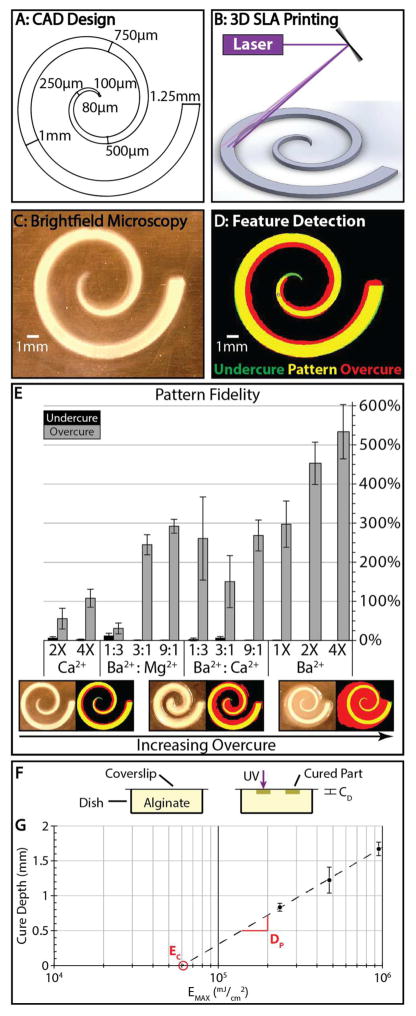
Figure 3.
(A) Initial CAD design for a flat spiral structure. (B) Schematic showing 3D printing of spiral structure. (C) Representative brightfield image of a printed spiral. (D) Corresponding feature detection with overcure (red) and undercure (green). (E) Pattern fidelities for various precursor solutions with varying ion composition and concentration (n = 6 per condition). Error bars represent standard deviation. (F) Experimental setup for the modified “windowpane” test used to calculate the working curve. (G) The working curve for 3% alginate with 1:3 Ba2+: Mg2+ used to empirically determine the critical exposure (EC) and the penetration depth (DP). Trendline R2 = 0.9984. Error bars represent standard deviation.

