Figure 6.
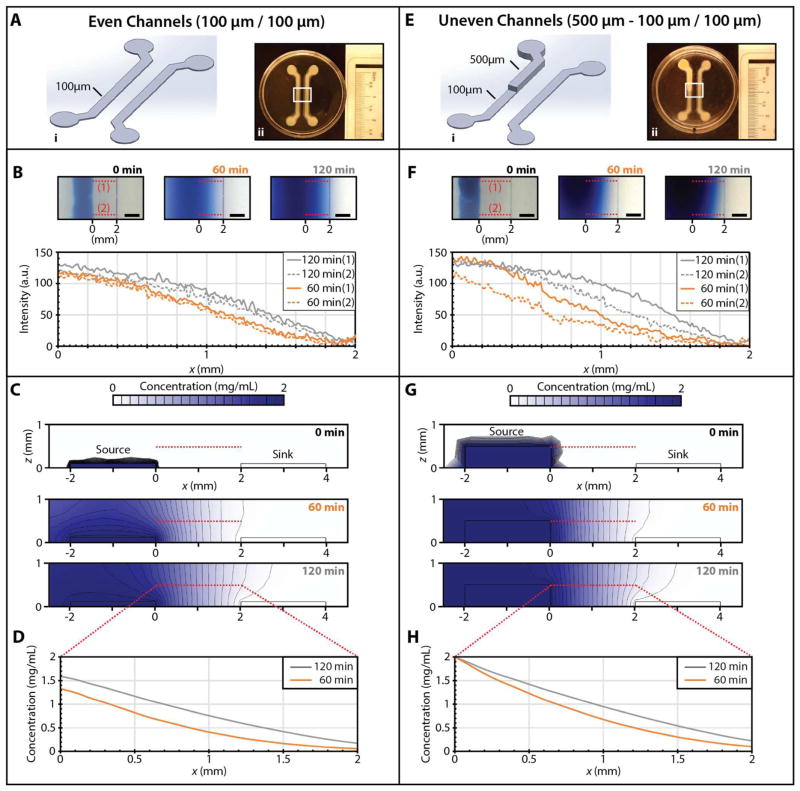
Comparison of gradients generated between source and sink channels of even and uneven height, which are expected to establish spatially nonuniform concentration profiles both laterally and vertically. (A) Even 100 μm source and sink channels encapsulated in 1.5% agarose. (i) CAD design, (ii) Alginate printed template. (B) Evans Blue intensity (arbitrary units) as a function of time for a gradient between source and sink channels. Note that the intensity profiles at location 1 and 2 are comparable over time. (C) COMSOL simulations of Evans Blue diffusion in 1.5% agarose between even channels. (D) Simulated concentration profiles as a function of time at a height of z = 500 μm. (E) Uneven 100–500 μm source and 100 μm sink channels encapsulated in 1.5% agarose (i) CAD design, (ii) Alginate printed template. (F) Evans Blue intensity (arbitrary units) as a function of time for a gradient between source and sink channels. Note that the intensity profile is diffusing more rapidly at location 1 relative to location 2, due to the taller source channel at location 1. (G) COMSOL simulations of Evans Blue diffusion in 1.5% agarose between even channels. (H) Simulated concentration profiles as a function of time at a height of z = 500 μm.

