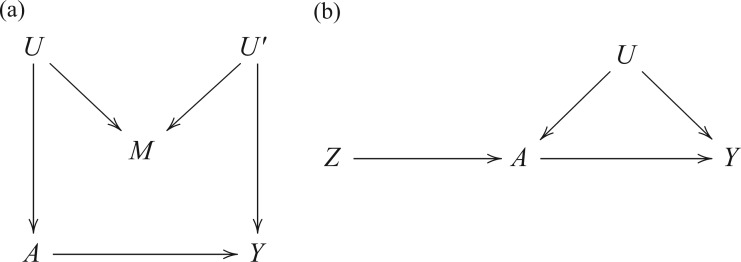
Fig. 1.
Two directed acyclic graphs, where  is the treatment and
  is the outcome of interest. (a) Directed acyclic graph for M-bias, where
  and
and  are unobserved and
  is observed. (b) Directed acyclic graph for Z-bias, where
  is an unmeasured confounder and
  is an instrumental variable for the treatment-outcome relationship.

