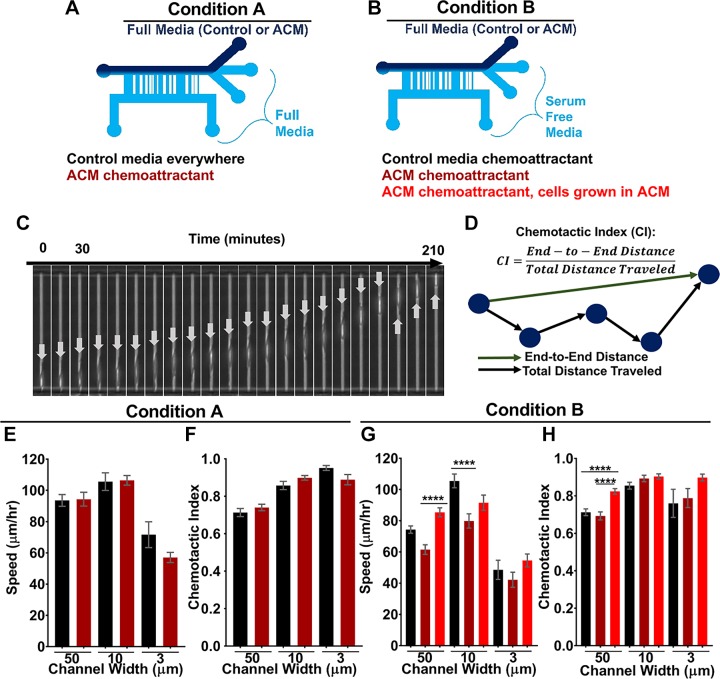
Figure 11.
A) Diagram of experimental setup where ACM serves as the sole chemoattractant (condition A). B) Diagram of experimental setup where ACM and serum are chemoattractants (condition B). Cells cultured in control medium or ACM. C) Image sequence taken of a single cell at 10-min intervals (indicated by arrows) traveling through a 6-µm channel with serum as a chemoattractant. The arrows indicate the same cell and are relocated from the leading to the trailing edge of cell because of space constraints at the end of the channel. D) Chemotactic index calculation. E, F) Speeds (E) and chemotactic indices (F) of cells traveling through microchannels of 3, 10, and 50 μm widths from control medium toward ACM or control medium (condition A). n(50-µm channels with control medium everywhere) = 152; n(50-µm channels with ACM as chemoattractant) = 212; n(10-µm channels with control medium everywhere) = 97; n(10-µm channels with ACM as chemoattractant) = 233; n(3-µm channels with control medium everywhere) = 18; and n(3-µm channels with ACM as chemoattractant) = 57 cells. G, H) Speeds (G) and chemotactic indices (H) of cells traveling through microchannels of 3, 10, and 50 μm widths from serum-free medium toward ACM or control medium (condition B). n(50-µm channels with control chemoattractant) = 200; n(50-µm channels with ACM as chemoattractant) = 158; n(50-µm channels with ACM as chemoattractant and cells pretreated in ACM) = 205; n(10-µm channels with control chemoattractant) = 183; n(10-µm channels with ACM as chemoattractant) = 126; n(10-µm channels with ACM as chemoattractant and cells pretreated in ACM) = 122; n(3-µm channels with control chemoattractant) = 18; n(3-µm channels with ACM as chemoattractant) = 23; and n(3-µm channels with ACM as chemoattractant and cells pretreated in ACM) = 63 cells. The tracking time interval was 10 min for up to 15 h. Statistical analysis was performed with a Tukey’s multiple-comparison post hoc test. In all plots, bars indicate the mean of pooled data from N ≥ 3 independent experiments, and error bars represent the sem. In some conditions, cells migrated into 3-µm channels in only 2 of 3 trials. ****P < 0.00005.

