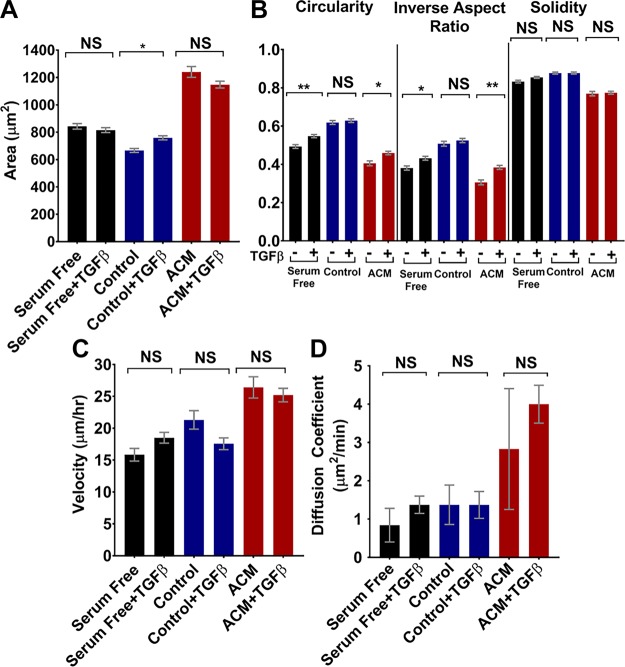
Figure 8.
A, B) Areas (A) and circularities, inverse aspect ratios, and solidities (B) of MDA-MB-231 cells treated with control medium, serum-free medium, or ACM, with or without 10 ng/ml TGF-β. n(serum free – TGF-β) = 264; n(serum free + TGF-β) = 466; n(control – TGF-β) = 284; n(control + TGF-β) = 408; n(ACM – TGF-β) = 159; n(ACM + TGF-β) = 383 cells. C, D) Velocities (C) and diffusion coefficient (D) obtained from a Langevin-type fit to MSD curves over 200 min. n(serum free – TGF-β) = 54; n(serum free + TGF-β) = 66; n(control – TGF-β) = 49; n(control + TGF-β) = 71; n(ACM – TGF-β) = 33; n(ACM + TGF-β) = 74 cells. Time intervals, 5–6.7 min for 500–670 min. Statistics obtained with a 1-way ANOVA and Tukey’s post hoc analysis. In all plots, bars indicate the mean of pooled data from N independent experiments, and error bars represent sem (N ≥3 for all conditions, except the ACM condition, where n = 2). *P < 0.05, **P < 0.005.

