Figure 2.
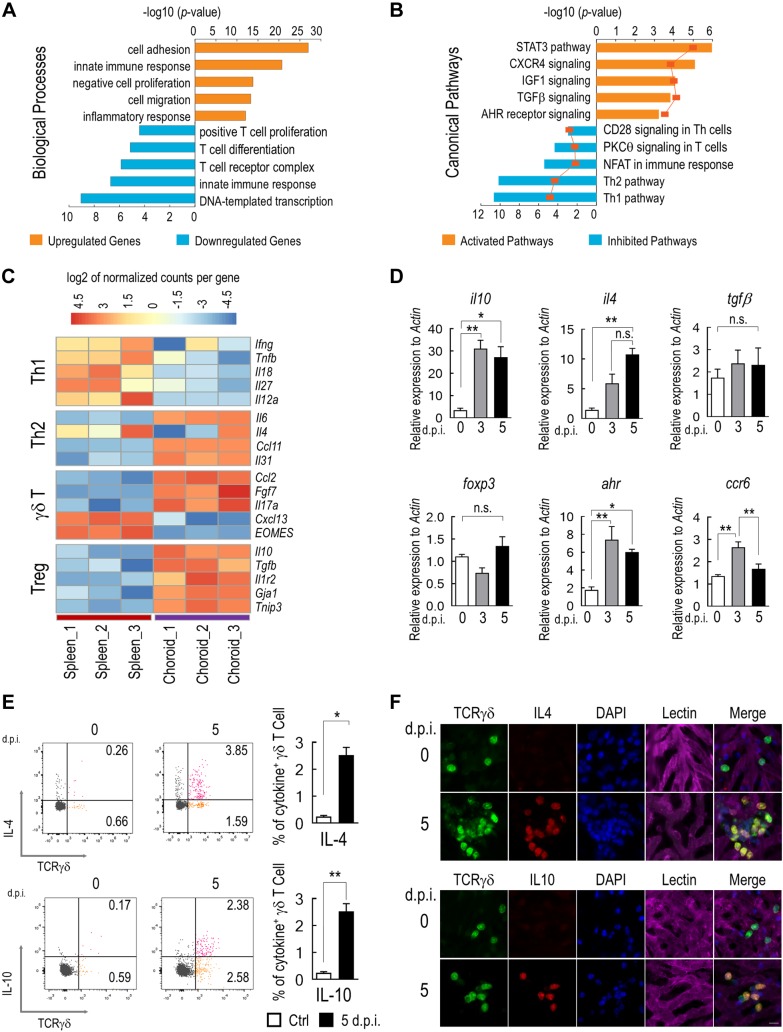
Production of immunosuppressive cytokines by choroidal γδ T cells. A) Top over-represented biologic processes, as determined by gene ontology analysis, among differentially expressed genes (fold change >2; Padj < 0.01, Benjamini-Hochberg procedure) between choroidal and splenic γδ T cells. B) Significantly enriched immunology canonical pathways (P < 0.01; Fisher’s exact test) were illustrated with respective percentages of overlapped genes shown on the line graph. Pathway activation and inhibition were determined by z score. C) Heat map of representative genes related to distinct T-cell functions. D) Quantitative RT-PCR analyses of genes that are indicative of γδ–T-cell function. γδ T cells were purified from mice that were treated with NaIO3 at indicated times (n = 5, 1-way ANOVA with Bonferroni test). E) Flow cytometry analyses and quantification of IL-4 and IL-10 expression by choroidal γδ T cells (n = 3, Student’s t test). F) Representative images of costaining of IL-4 or IL-10 with TCRγδ on choroidal flat mounts. Data are presented as mean ± sem. *P < 0.05, **P < 0.01. Scale bar, 20 μm.

