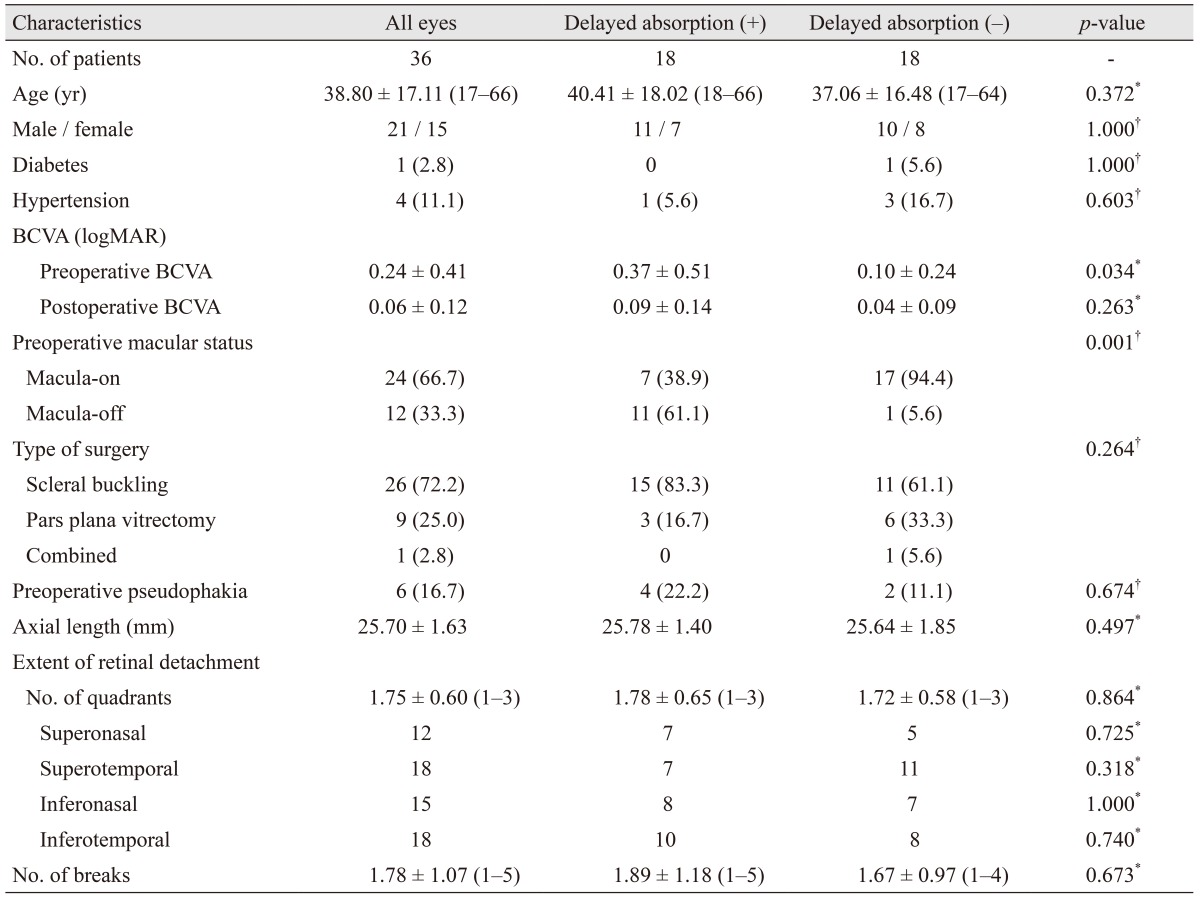
Table 1. Demographics and comparisons according to the presence of delayed absorption of subretinal fluid after surgery.
Values are presented as mean ± standard deviation (range), number (%), or mean ± standard deviation.
BCVA = best-corrected visual acuity; logMAR = logarithm of the minimal angle of resolution.
*A p-value was calculated by the Mann-Whitney U-test; †A p-value was calculated by the Fisher exact test.

