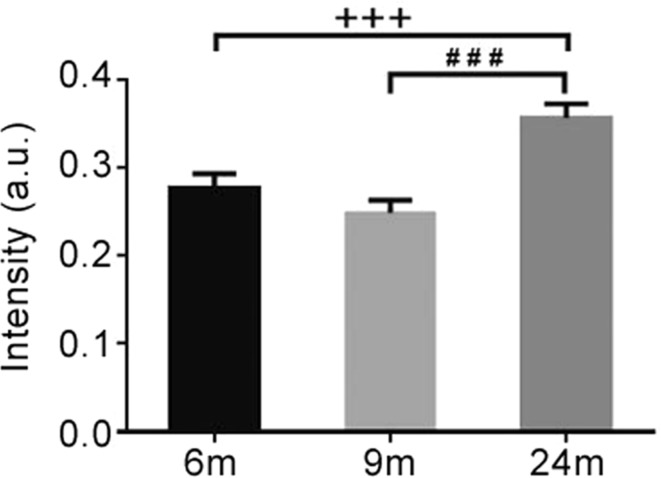
Fig. 6.
Semi-quantitative analysis of fluorescence intensity of phospho-α-syn immunoreactivity in the small intestine (distal segment) of transgenic mice at different ages. One-way ANOVA (F = 12.029, P = 0.001) followed by LSD post hoc test (### P < 0.005, 9 vs 24 months; +++ P < 0.005, 6 vs 24 months); error bars SEM.

