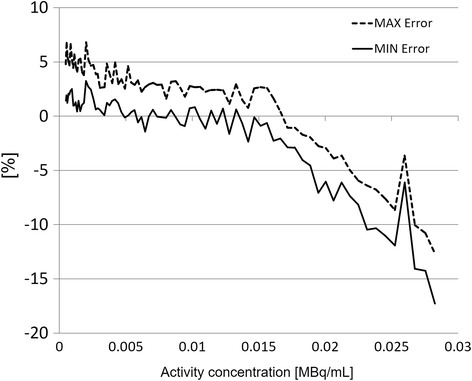
Fig. 4.

Maximum and minimum relative count rate errors for the different activity distributions. The dashed line shows the maximum value; the solid line shows the minimum value. The first 3 and the last 3 slices of the acquisitions were excluded from this evaluation
