Fig. 8.

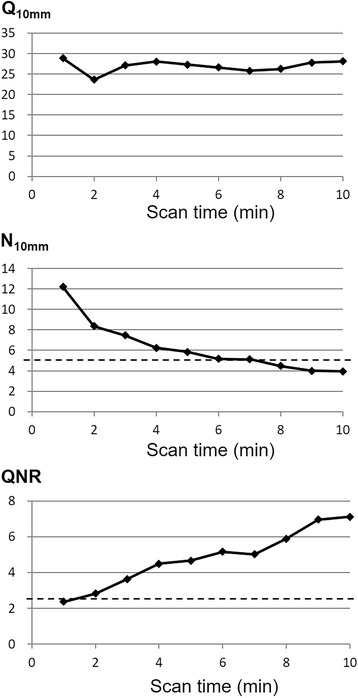
The relationships of the % contrast (Q H,10mm), the % background variability (N 10mm), and the QNR with different scan times. The dotted lines indicate the recommended values (N 10mm < 5.6%, QNR > 2.8)

The relationships of the % contrast (Q H,10mm), the % background variability (N 10mm), and the QNR with different scan times. The dotted lines indicate the recommended values (N 10mm < 5.6%, QNR > 2.8)