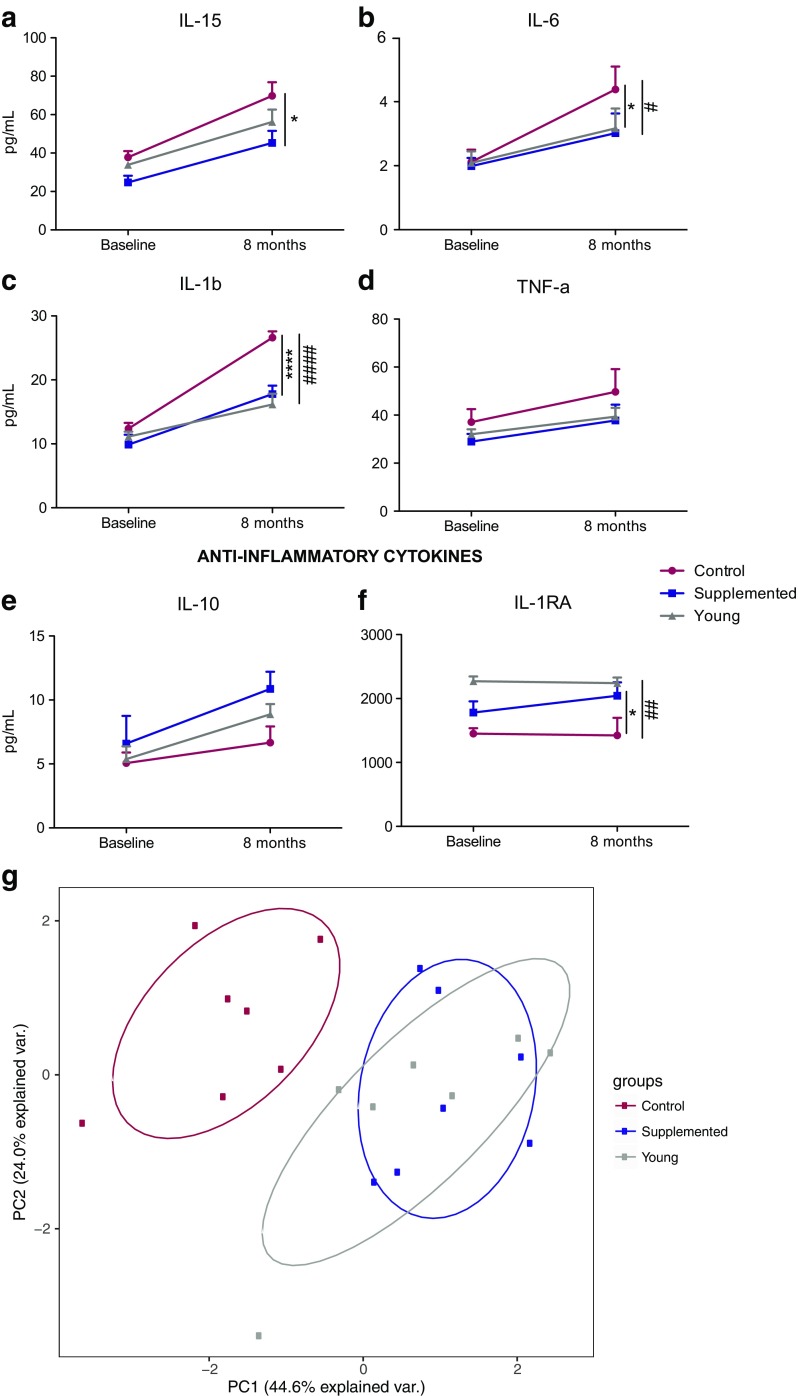
Fig. 3.
Plasma cytokine profiles. a–f Pro-inflammatory (a–d) and anti-inflammatory e–f cytokine levels were determined using Luminex technology at the baseline and necropsy time points. Left y-axis, mean pg/ml ± SEM (*P < 0.05; ****P < 0.0001 supplemented macaques compared to aged non-treated controls; #P < 0.05; ####P < 0.0001 young macaques compared to non-treated aged controls). g Principal component analysis of the cytokines presented in a–f showing that androgen-supplemented animals are similar to young animals while control non-supplemented aged animals segregate away

