Fig. 1.
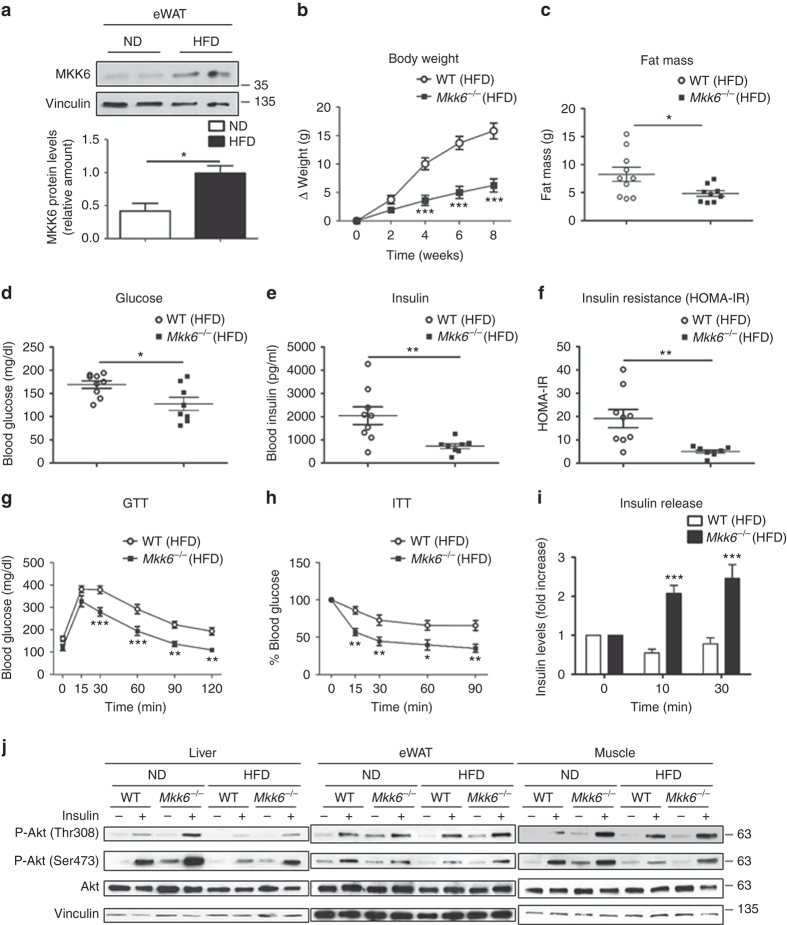
Mkk6 −/− mice are protected against diet-induced obesity and hyperglycemia a Western blot showing elevated MKK6 expression in epididymal white fat (eWAT) from WT mice fed a HFD for 8 weeks. A representative blot from three technical replications (top) and quantification (bottom) are shown (mean ± SEM; *p < 0.05, ND vs HFD t test, n = 4 mice). b Body weight time course in WT and Mkk6 −/− male mice (8–10 weeks old) fed a HFD over 8 weeks. Data are presented as the increase above initial weight. HFD-induced weight gain was significantly higher in WT than Mkk6 −/− mice (mean ± SEM, WT n = 10 mice; Mkk6 −/− n = 7 mice). c Fat mass in Mkk6 −/− and WT mice after 8 weeks of HFD (mean ± SEM, WT n = 10 mice; Mkk6 −/− n = 9 mice). d, e Fasting blood glucose and insulin in Mkk6 −/− and WT mice fed the HFD (8 weeks) (mean ± SEM, WT n = 9 mice; Mkk6 −/− n = 8 mice). f Insulin resistance rate in WT and Mkk6 −/− mice calculated as homeostasis model assessment (HOMA-IR) ratio (mean ± SEM, WT n = 9 mice; Mkk6 −/− n = 8 mice). g, h Glucose tolerance test (GTT), and insulin tolerance test (ITT) in WT and Mkk6 −/− mice fed the HFD (8 weeks). Blood glucose concentration was measured in mice given intraperitoneal injections of glucose (1 g/kg) or insulin (0.75 IU/kg) (mean ± SEM, WT n = 10 mice; Mkk6 −/− n = 7 mice). i Insulin release test in HFD-fed WT and Mkk6 −/− mice. Mice received i.p. glucose (2 g/kg) after overnight fasting (mean ± SEM, WT n = 9 mice; Mkk6 −/− n = 6 mice). j Western blot analysis of Akt activation in liver, epididymal white adipose tissue (eWAT), and skeletal muscle from mice fed normal chow diet (ND) or high-fat diet (HFD). Mice were treated without or with insulin (1.5 IU/kg) for 15 min after overnight fasting. Each line represents a pool of tissue from 4 mice.*p < 0.05, **p < 0.01, ***p < 0.001 WT vs Mkk6 −/− (two-way ANOVA coupled to Bonferroni’s post-tests or t test or Welch’s test when variances were different)

