Fig. 2.
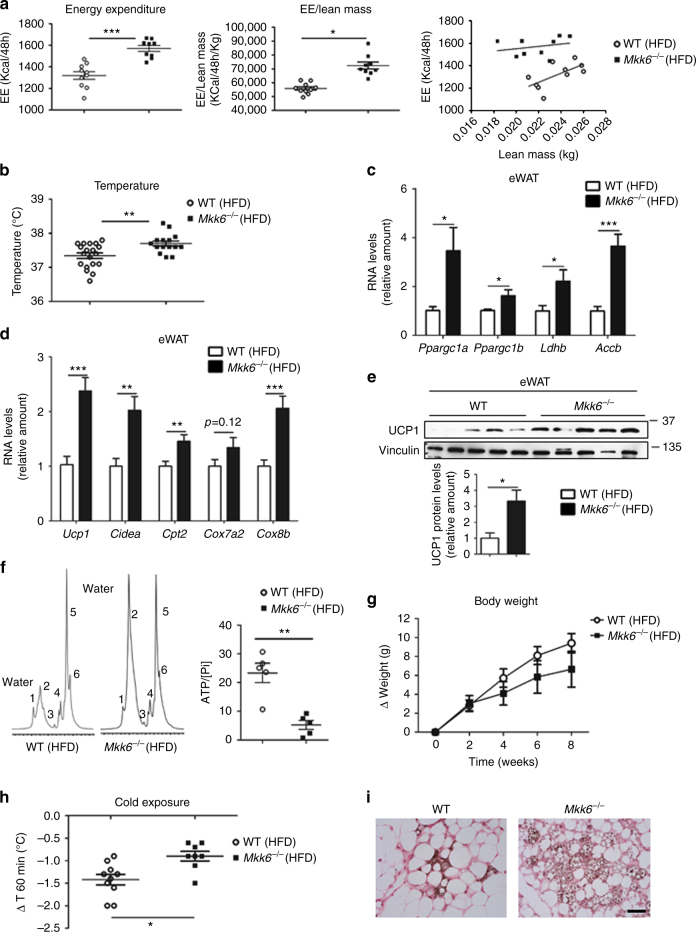
Mkk6 −/− mice have higher energy expenditure by increased thermogenesis. a Comparison of energy balance between HFD-fed WT and Mkk6 −/− mice. Mice were fed the HFD for 8 weeks and examined in a metabolic cage over a 2-day period to measure energy expenditure (EE). EE levels non-corrected (left), corrected by lean mass (centre), or an ANCOVA analysis (right) are shown (mean ± SEM, WT n = 10 mice; Mkk6 −/− n = 9 mice). b Body temperature of HFD-fed WT and Mkk6 −/− mice (mean ± SEM, WT n = 19 mice; Mkk6 −/− n = 15 mice). c, d qRT-PCR analysis of thyroid-hormone-responsive genes and browning-associated genes in epididymal fat (eWAT). Data were normalized to the expression of Gapdh mRNA in each sample, and are presented as mean ± SEM (WT n = 7–23 mice, Mkk6 −/− n = 5–19 mice). e Western blot analysis of uncoupling protein 1 (UCP1) in epididymal (eWAT) of WT and Mkk6 −/− mice. Quantification of eWAT UCP1 protein levels is also shown (mean ± SEM, n = 5 mice). f Representative white adipose tissue MR spectrum (from 5 mice) from WT (left) and Mkk6 −/− (right) mice fed the 8-week HFD. WAT from Mkk6 −/− shows a BAT-like pattern with two large peaks of emission corresponding to water peak (peak 2 at 4.8 p.p.m.) and lipid component (peak 5 at 1.6–1.3 p.p.m.). Also showed quantification of ATP cellular content respect total (cytosolic and mitochondrial) free inorganic phosphate (Pi) (peak at 5.3–5 p.p.m.) in eWAT (mean ± SEM, n = 5 mice). g Body weight changes in WT and Mkk6 −/− mice during the 8-week HFD period; mice were housed at 30 °C. (mean ± SEM, WT n = 10 mice; Mkk6 −/− n = 7 mice). h Effect of cold exposure (4 °C, 60 min) on body temperature in WT and Mkk6 −/− mice fed the 8-week HFD (mean ± SEM, WT n = 10 mice; Mkk6 −/− n = 8 mice). i Staining of UCP1 after 1 week of cold exposure in sWAT. Scale bar: 50 µm. Statistically significant differences between Mkk6 −/− mice and WT mice are indicated: *p < 0.05; **p < 0.01; ***p< 0.001 (t test or Welch’s test when variances were different)

