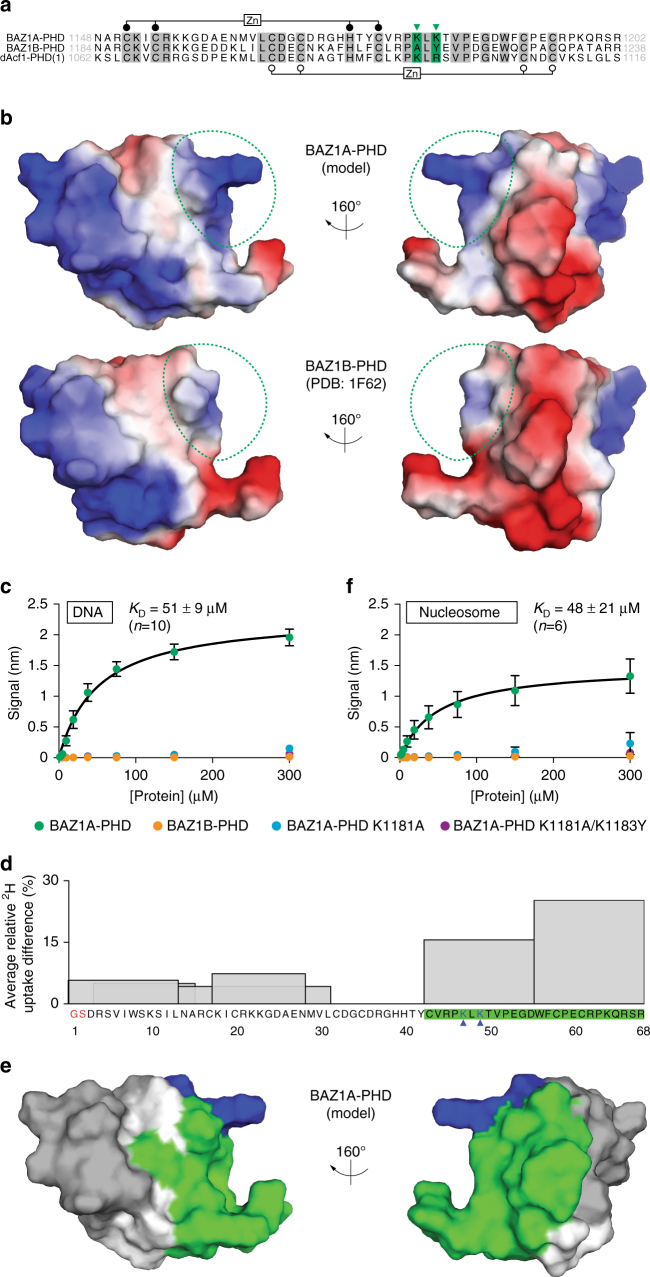
Fig. 6.
The PHD module of BAZ1A binds free and nucleosomal DNA. a Sequence alignment of the PHD modules of BAZ1A, BAZ1B, and the most N-terminal PHD module of dAcf1 amino acid boundaries are indicated, and identical residues are highlighted in gray. Filled and open circles indicate the Zn-binding Cys4HisCys3 motif characteristic of the PHD fold. Green arrowheads indicate K1181 and K1183 that are required for BAZ1A-PHD to bind DNA. b Electrostatic surface representation of BAZ1A-PHD (model) and BAZ1B-PHD (PDB: 1F62). Red and blue indicate negatively and positively charged areas, respectively. The positively charged surface formed by K1181 and K1183 in the BAZ1A-PHD model and the corresponding region in BAZ1B-PHD are outlined in dotted green. c Steady-state biolayer interferometry measurement of DNA binding to wild-type BAZ1A-PHD, BAZ1B-PHD, or mutant versions of BAZ1A-PHD bearing the single K1181A or the double K1181A/K1183Y substitutions. d Average relative deuterium uptake difference (ARDD) for BAZ1A-PHD bound to DNA compared to uncomplexed BAZ1A-PHD, measured by HDX-MS. The values for six matching peptides (recovered from both DNA-bound and uncomplexed samples) are represented by histograms spanning the corresponding amino acid sequence of the BAZ1A-PHD construct. No matching peptides were obtained for residues 32–42 and histograms of overlapping peptides are shown in transparency. Residue numbering refers to the tag-free expression construct used for this experiment; residues colored in red do not belong to the endogenous BAZ1A sequence. The two lysine residues colored in blue and highlighted with blue arrowheads correspond to K1181 and K1183. Peptide sequences with the highest ARDD values (>10%) are highlighted in green; see Supplementary Fig. 7a, and the “Methods” section for more details. e Peptides with the highest ARDD values (>10%) were mapped on the BAZ1A-PHD model surface and shown in green. K1181 and K1183 (residues 47 and 49 in d) are colored in blue, and white areas correspond to residues 32–42, for which no ARDD data was obtained. f Same as c but using mononucleosomes. Each data point is the mean value ± s.e.m from four independent experiments. Fitted K Ds were determined from the averaged data and reported ± standard error

