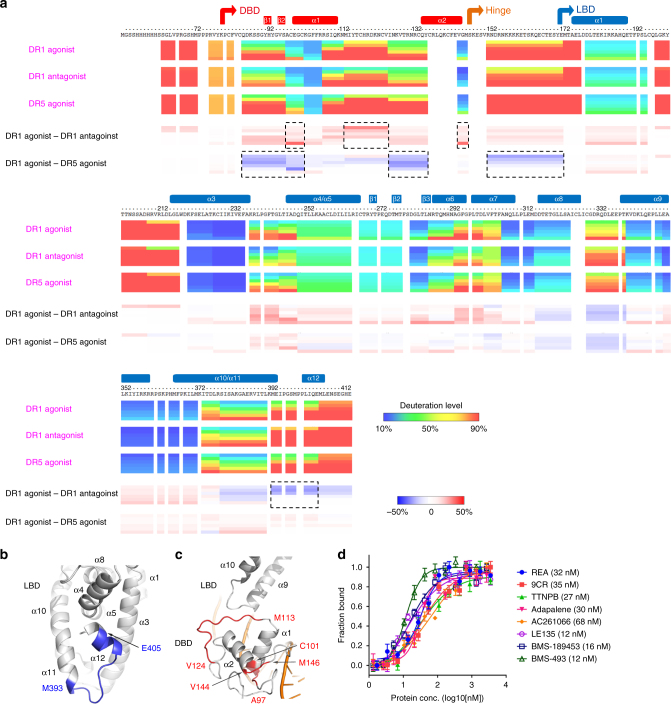
Fig. 2.
Dynamic features of RARβ protein in the RARβ–RXRα heterodimer measured by H/D-ex MS and effects of different ligands on DNA binding. a The three ribbon maps showing the deuteration level of RARβ residues are from states in the presence of DR1 DNA and agonist REA (1st row), DR1 DNA and antagonist BMS-189453 (2nd row), DR5 DNA and agonist REA (3rd row), respectively. The 4th row shows the differences between 1st and 2nd rows (i.e., DR1 agonist minus DR1 antagonist), while the 5th shows those between 1st and 3rd (i.e., DR1 agonist minus DR5 agonist). The regions with relative larger differences are boxed by dotted lines. For each map, there were six time points (30, 100, 300, 1000, 3000, and 10,000 s, from top to bottom). The domain ranges and secondary structures are labeled above the protein sequence. b, c Regions in RARβ LBD (b) and DBD (c) displaying more (red) or less (blue) dynamics in the hydrogen/deuterium exchange, when comparing the data from DR1 and agonist (REA) to those from DR1 and antagonist (BMS-189453) (i.e., corresponding to the 4th row in Fig. 2a). The secondary structures and residue ranges are labeled accordingly. d DNA-binding affinities of RARβ–RXRα heterodimer to DR1 DNA measured in the presence of different ligands. REA, 9CR, TTNPB, adapalene, and AC261066 are agonists for RARβ; while LE135 and BMS-189453 are antagonists, and BMS-493 is an inverse agonist for RARβ. K D values are in parentheses. The heterodimer protein was incubated with each ligand at 8× concentrations for 1 h before assays started. The data points are plotted as mean ± SD from three technical replicates respectively

