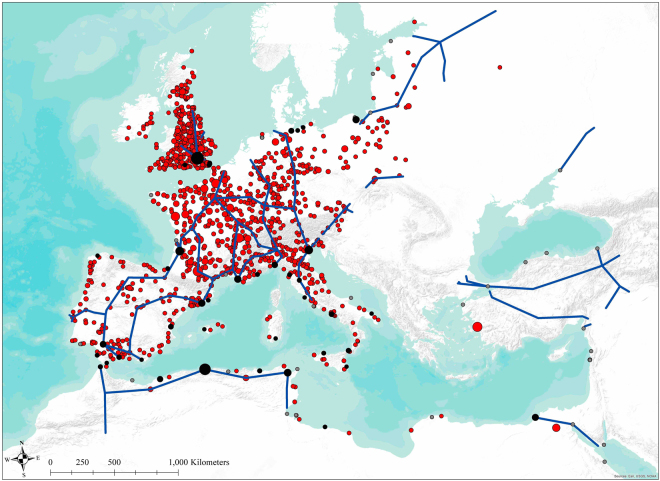
Figure 2.
Sporadic plague outbreak (N < 5) did not follow the pattern of major trade routes. The red spots represent the locations of sporadic outbreak of plague (856 locations). The blue lines indicate the major trade route within our study period. The black dots identify the major trade ports with plague outbreak. The trade ports with no reported plague outbreak within our study period are labeled in grey dots. The map is generated in ArcGIS version 10.1 (www.esri.com/software/arcgis).

