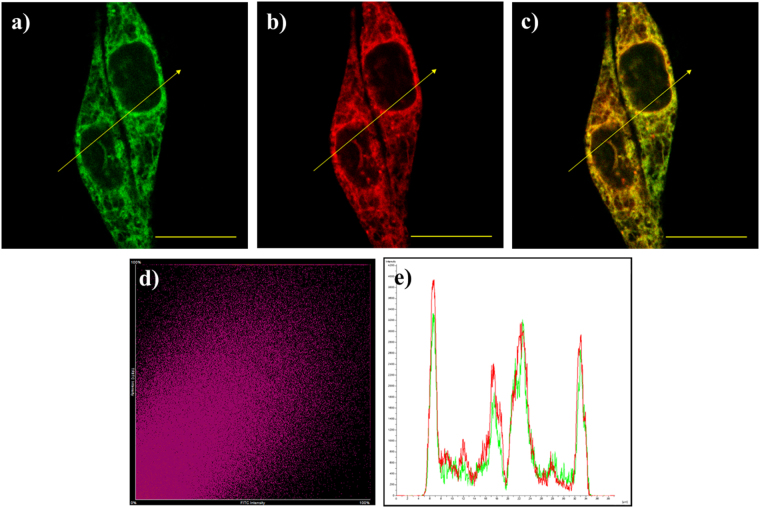
Figure 6.
The images of the living HeLa cells co-incubated with the probe Na-H 2 S-ER (5 μM), Na2S (50 μM), and ER-Tracker TM Red. (a) The fluorescence image of the green channel; (b) The fluorescence image of the red channel; (c) The merged image of (a and b,d) Intensity scatter plot of the green and red channels. (e) Intensity profile of linear region of interest across in the HeLa cells co-stained with ER-Tracker Red and green channel of Na-H 2 S-ER. Scale bar: 20 μm.

