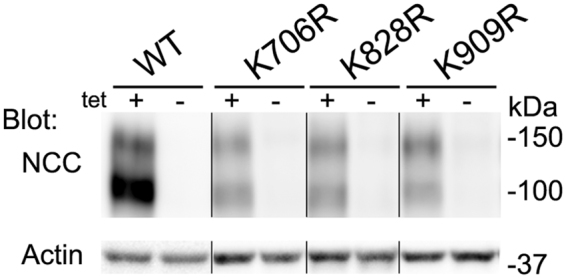
Figure 3.

Isogenic MDCKI cell lines for WT-NCC and K706R, K828R and K909R mutants show tetracycline inducible NCC expression. Representative immunoblots of NCC and actin in protein samples isolated from various MDCKI cell lines grown on plastic. Following tetracycline (10 µg/ml) induction NCC is observed as a core non-glycosylated band around 100 kDa and a protein smear at 130 kDa corresponding to the glycosylated monomer. Samples are not run on the same blot, hence a direct comparison of expression levels is not possible.
