Figure 7.

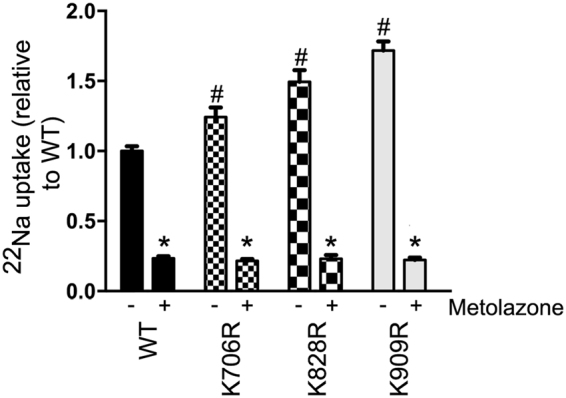
MDCKI cells expressing K706R, K828R and K909R mutants have significantly higher 22Na fluxes relative to WT-NCC expressing cells. Quantitative assessment of 22Na uptake in various MDCKI cells in the presence (+) or absence (−) of metolazone (Met) in the uptake medium. Data were analyzed using a two-way ANOVA followed by Tukey-Kramer multiple comparison test. Data are means ± S.E.M. (n = 12–24). *Represents significant difference compared to without metolazone condition. #Represents significant differences compared to WT-NCC without metolazone.
