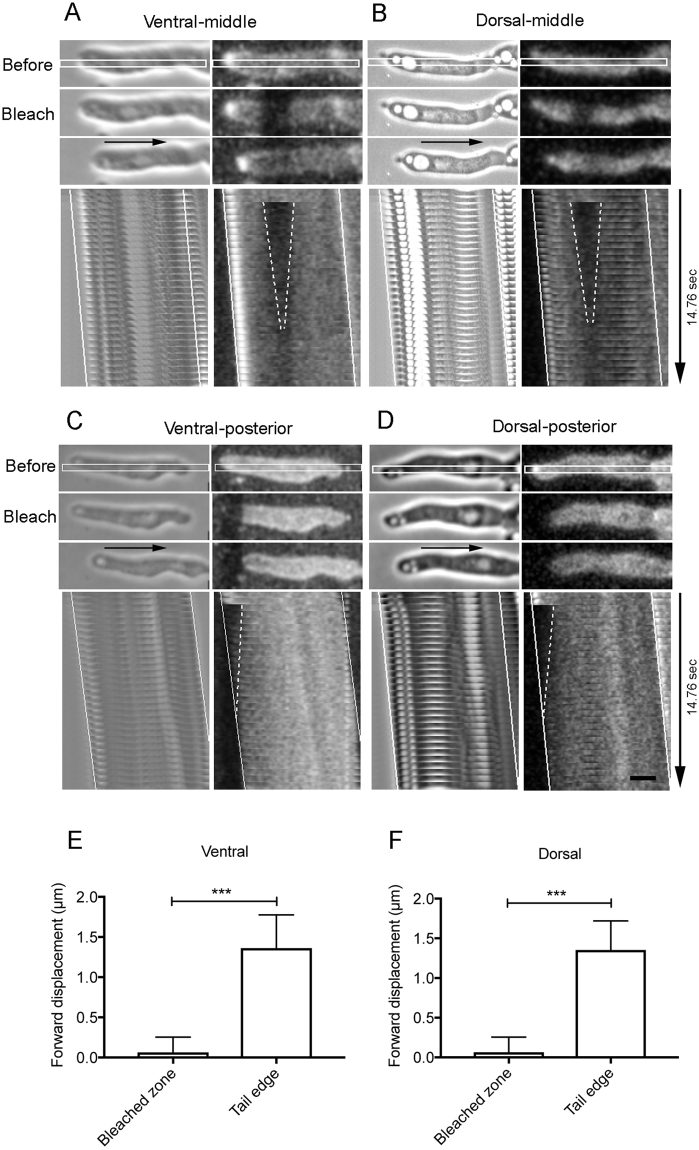
Figure 6.
Circulation of the cell membrane during cell migration. Photobleaching experiments in fast-migrating cells. Aggregation-competent cells were stained with Polaric, and the small vertical rectangle regions in the ventral (A and C) and dorsal cell membrane (B and D) were photobleached using a confocal microscope. Middle (A and B) and posterior (C and D) regions of the cells were bleached, respectively. In each of panel A–D, phase-contrast (left) and fluorescence (right) images before photobleaching, immediately after photobleaching, and after fluorescence recovery are shown. The directions of cell migration are indicated by black arrows. The lower figure in each panel shows a kymograph of the white rectangle shown in each top figure. The white dotted lines show the fluorescence recovery of bleached regions, and the solid lines show the advance of both ends (anterior and posterior) of the migrating cells, respectively. Graphs E and F show summaries of forward displacements of the bleached zones and tail edges of multiple cells (n = 18 each) in the ventral (E) and dorsal (F) for 4.8 sec, respectively. Note that the bleached regions did not move relative to the substratum, whereas the cell advanced. Data are presented as mean ± SD and analyzed by unpaired two-tailed Student’s t-test. ***P ≤ 0.0001. Bar, 10 µm.

