Figure 4.
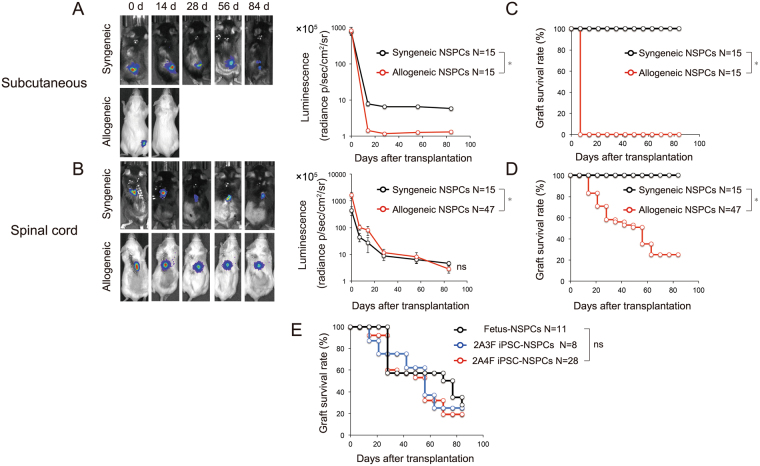
Bioluminescence and graft survival rate after transplantation of fetus-NSPCs and iPSC-NSPCs into syngeneic and allogeneic mice. (A,B) Bioluminescence images of representative mice at 0, 14, 28, 56, and 84 days after transplantation, and quantitative analyses of CPM derived from grafted fetus-NSPCs and two lines of iPSC-NSPCs (2A3F and 2A4F) in subcutaneous lesions and spinal cords (black line = syngeneic transplantation; red line = allogeneic transplantation). (C,D,E) Graft survival rates after transplantation into subcutaneous lesions (C) and spinal cords (D and E). The black line shows the fetus-NSPCs transplantation group, the blue line shows the 2A3F iPSC-NSPCs transplantation group, and the red line shows the 2A4F iPSC-NSPCs transplantation group. Values represent the mean ± SEM. *P < 0.05, one-way ANOVA followed by the Tukey–Kramer test. The graft survival rates were assessed using Kaplan–Meier survival curves. *P < 0.05, Gehan-Breslow-Wilcoxon test. ns, not significant. In (A–E), N indicates the number of mice.

