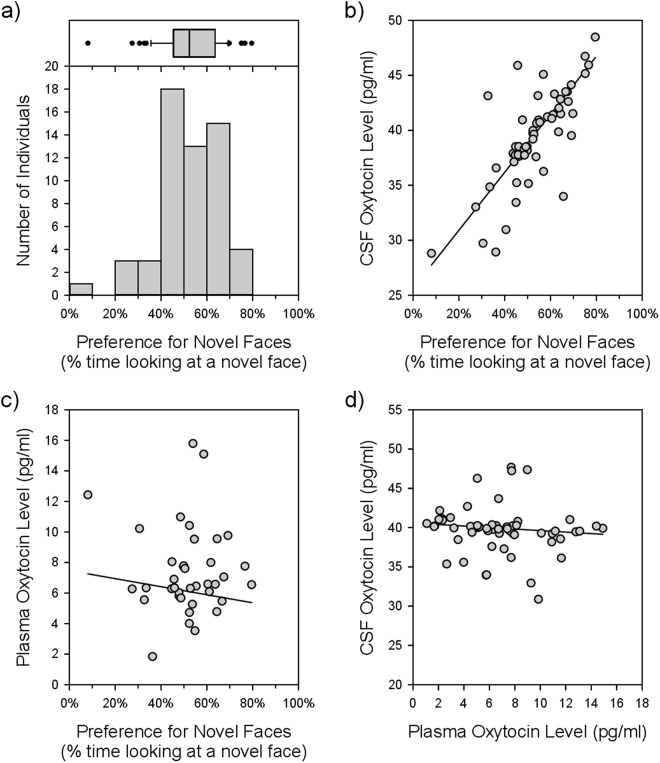
Figure 1.
Infant preference for novel faces and later measures of oxytocin (OT) biology. (a) Individual variation in visual preference for novel faces. The box-and-whisker plot shows the interquartile range and median (box), and the 10th and 90th percentiles (whiskers), and remaining outliers. (b) Early preference for novel faces predicts later cerebrospinal fluid (CSF) OT concentrations (P = 0.0048). CSF OT concentrations are corrected to reflect the Weighted Least Squares General Linear Model (WLS-GLM) analysis, and are thus plotted as the expected value for each data point, plus the weighted residual. (c) Preference for novel faces does not predict later plasma OT concentrations (P = 0.2138); as before, the y axis values (plasma OT level) are corrected. (d) Plasma OT concentrations do not predict CSF OT concentrations (P = 0.8674), as before the y axis (CSF OT level) is corrected. In panels (b,c, & d), the line depicts the expected values for each data point from the WLS-GLM regression equation.

