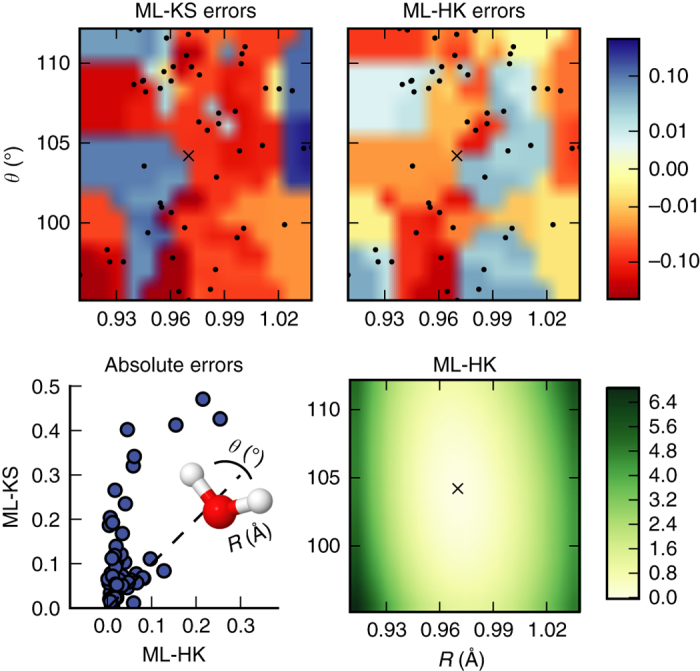
Fig. 2.

Result of the comparison for H2O. (Top) Distribution of energy errors against PBE on the H2O data set for ML-KS and ML-HK. The errors are plotted on a symmetric log scale with a linear threshold of 0.01, using nearest neighbor interpolation from a grid scan for coloring. Black dots mark the test set geometries with averaged bond lengths. (Bottom left) Comparison of the PBE errors made by ML-HK and ML-KS on the test set geometries. (Bottom right) Energy landscape of the ML-HK map for symmetric geometries (R vs. θ). All models were trained on M = 15 training points. Energies and errors in kcal/mol. A black cross marks the PBE equilibrium position
