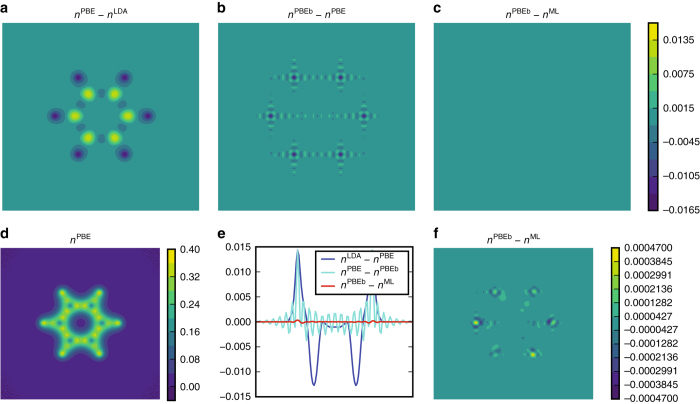
Fig. 4.
The precision of our density predictions using the Fourier basis for the molecular plane of benzene. The plots show a the difference between the valence density of benzene when using PBE and LDA functionals at the PBE-optimized geometry. b Error introduced by using the Fourier basis representation. c Error introduced by the n ML[v] density fitting (a–c on same color scale). d The total PBE valence density. e The density differences along a 1D cut of a–c. f The density error introduced with the ML-HK map (same data but different scale, as in c)

