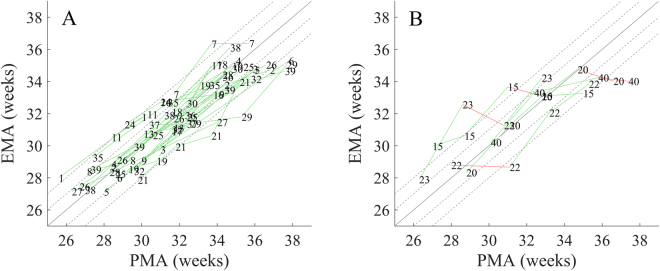
Figure 1.
The change in EEG maturational age (EMA) with the post-menstrual age of EEG recording (PMA) in individual infants with normal neurodevelopmental outcome at 12 months of age. (A) Infants with constantly increasing EMA with increasing PMA (normal growth) (n = 29). (B) Infants with instances of decreasing EMA with increasing PMA (deviant growth) (n = 5). Note that, these instances of deviant growth were due to a single outlier EMA (EMA from a recording with an absolute difference between EMA and PMA greater than 2 weeks). Figures show an EMA estimate based on 46 features with artefact detection and are calculated within a leave-one-infant-out cross-validation on a per recording basis (n = 101). The numbers denote infants and the additional lines track changes in longitudinal recordings: green lines denote an increase in EMA with increasing PMA, while red lines denote a decrease in EMA between consecutive EEG recording despite an increasing PMA. Underlying black lines indicate 0 (solid), 1 (dashed) and 2 (dashed) week differences between the EMA and the PMA.

