Figure 2.

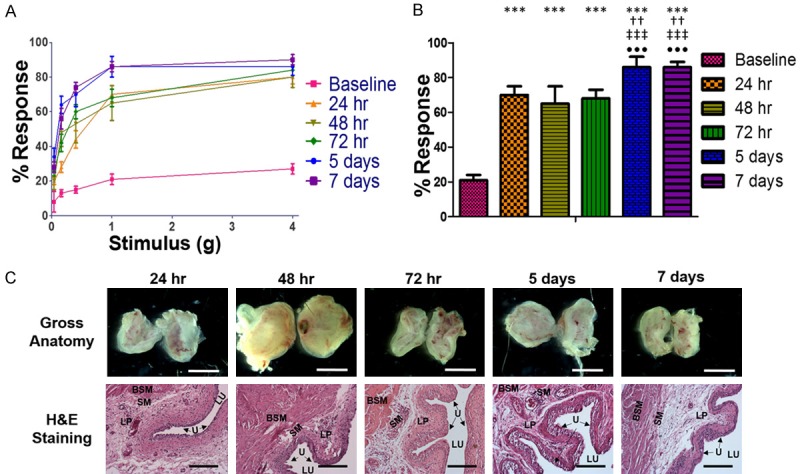
Results from time dependence assays. A. Response traces for mice at baseline and 24 hr, 48 hr, 72 hr, 5 days, and 7 days after the administration of 50 µL of 320 µM LL-37 intravesically. B. The referred pain response observed at 1 g stimulation to the lower abdomen. C. Images of the gross anatomy at 10 × magnification and H&E stained tissue sections taken at 200 × magnification. Pain response increased within 24 hours and achieved and reached peak values after 5 days. *** indicates a P<0.001 with respect to baseline. †† indicate a P<0.005 with respect to 24 hr. ‡‡‡ indicates a P<0.001 with respect to 48 hr. ••• indicates a P<0.001 with respect to 72 hr. The white scale bars in images of gross anatomy are 500 µm and the black scale bars in histology images are 50 µm. LU, lumen of the bladder. U, urothelium. SM, submucosa. LP, lamina propria. BSM, bladder smooth muscle layer.
