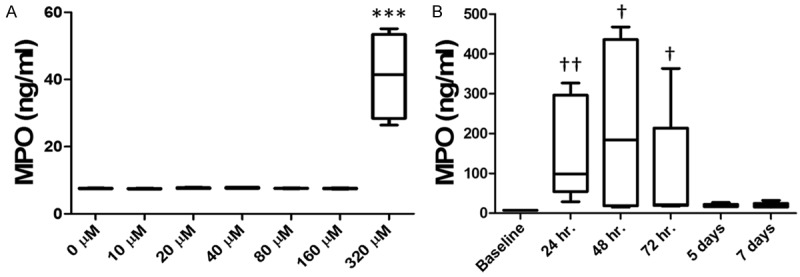
Figure 3.

Quantification of inflammatory response via MPO ELISA assay. (A) MPO concentration in bladder tissues at baseline and five days after the administration of 50 µL of 0, 10, 20, 40, 80, 160, and 320 µM LL-37 intravesically. 320 µM was very highly statistically elevated compared to baseline and all other dose administered within (A). *** indicates a P<0.001. (B) MPO concentration in the bladder at baseline and 24 hr, 48 hr, 72 hr, 5 days, and 7 days after the administration of 50 µL of 320 µM LL-37 intravesically. MPO levels peaked 48 hours after LL-37 challenge. MPO levels peaked 48 hours after LL-37 challenge, and was significant 24, 48 and 72 hours after administration. †, †† indicate a significance of P<0.05 and P<0.005 with respect to baseline, respectively. Significance was determined using a Kruskal-Wallis test.
