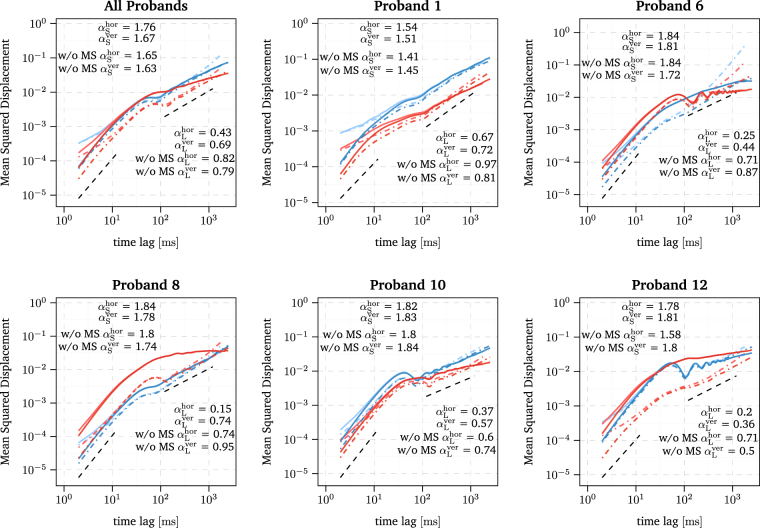
Figure 2.
Log-log plot of the horizontal and vertical MSD of smoothed experimental FEM data depicted in red and blue, respectively. The solid and dot-dashed lines indicate the MSD of trajectories with and without MSs, respectively. The DACF of the raw experimental FEM data is additionally depicted with the same linetype but in a lighter shade of blue and red. The estimated slopes of the smoothed data for the short and long time scale are denoted by α S and α L, respectively. Furthermore, the estimated slopes for the horizontal component without MSs are illustrated as black dashed straight lines in the ranges used for the linear regression, i.e. 2–12 ms and 120–1200 ms for the short and long time scale, respectively

