Figure 2.
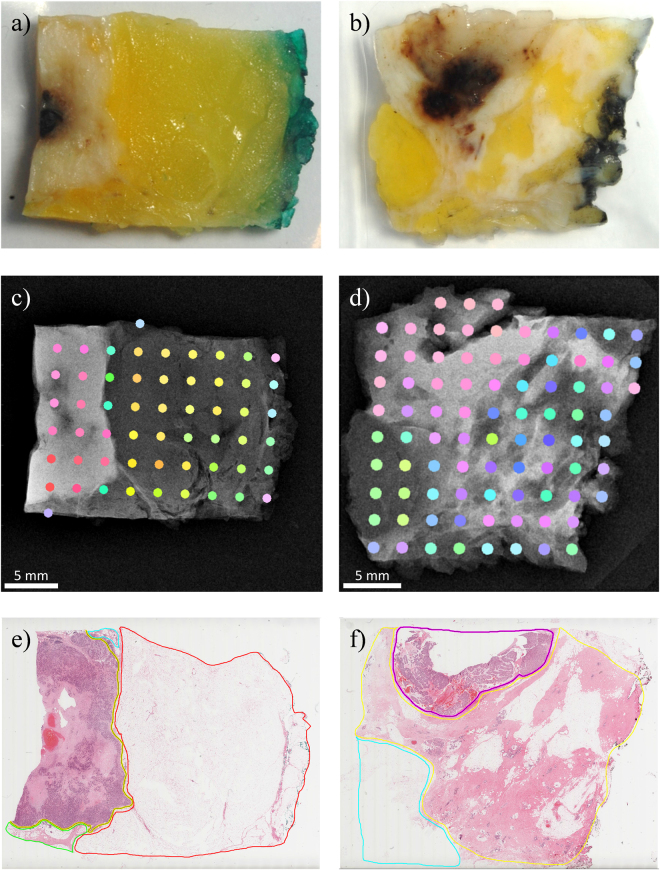
Comparison of two indicative samples showing (a,b) photographs of the samples as prepared, (c,d) colour-coded (based on principal component analysis (PCA) output) diffraction results overlaid on high resolution clinical mammography transmission X-ray images and (e,f) digital microscope images of a single slice through each sample. The boundaries demarcate the invasive tumour, normal breast tissue and fat as yellow, blue/green and red respectively in e and pink, yellow and blue respectvely in f.

