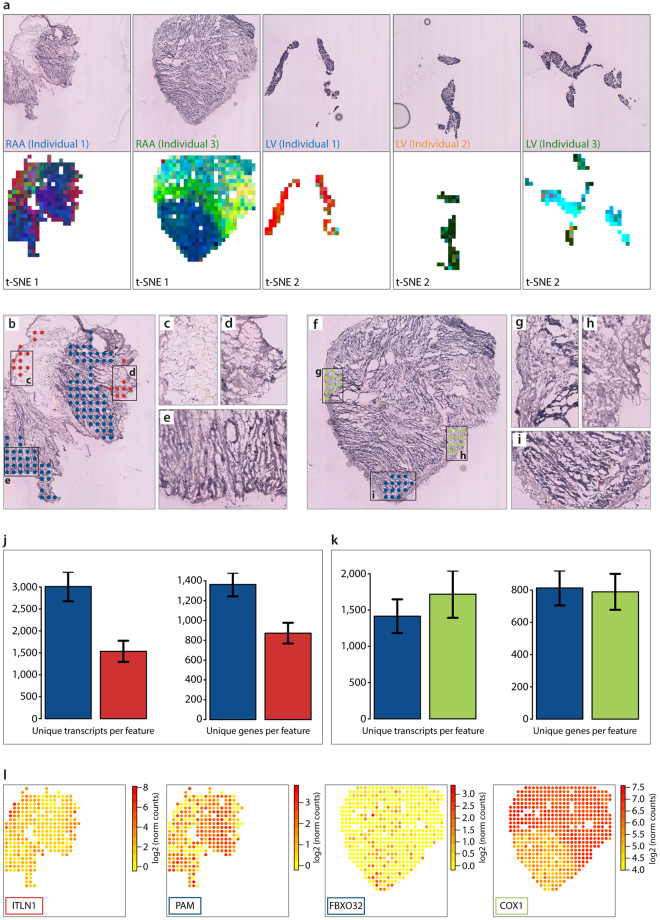
Figure 3.
Spatially resolved gene expression patterns within cardiac tissue sections. (a) Upper panel: Images of one hematoxylin- and eosin-stained replicate of each sample. Images have been cropped to match the area of the spatially barcoded microarray. Lower panel: Results of applying t-SNE analysis to data from RAA (4 samples in total; t-SNE 1) and LV (6 samples in total; t-SNE 2). Similar colors within the t-SNE plots reflect similar gene expression patterns. (b–i) Cell composition of right atrial appendage. (b) Selected features within the RAA of individual 1 corresponding to the colored areas in results of the t-SNE 1 analysis shown in (a). (c, d and e) Magnified images of corresponding areas in (b), showing: (c) an adipocyte-tissue-rich region, (d) a fibrous-tissue-rich region, and (e) a cardiomyocyte-rich region. (f) Selected features within the RAA of individual 3 corresponding to the colored areas in results of the t-SNE 2 analysis shown in (a). (g,h and i) Magnified images of corresponding areas in (f), showing: a pericardial fibrous-tissue-rich region (g,h) and a cardiomyocyte-rich region (i). (j) Barplots showing that the blue area (corresponding to the cardiomyocyte-rich region) contains ~2-fold more unique transcripts and ~1.6-fold more unique genes than the red area (corresponding to adipocyte- and fibrous-rich tissue). (k) Barplots showing that pericardial fibrous-tissue contains similar numbers of unique transcripts and genes per feature to cardiomyocyte-rich regions. Error bars indicate standard errors. (l) Spatially resolved expression heatmaps showing four differentially expressed genes between the blue and red area of individual 1, and between the blue and green area of individual 3.

