Figure 4.
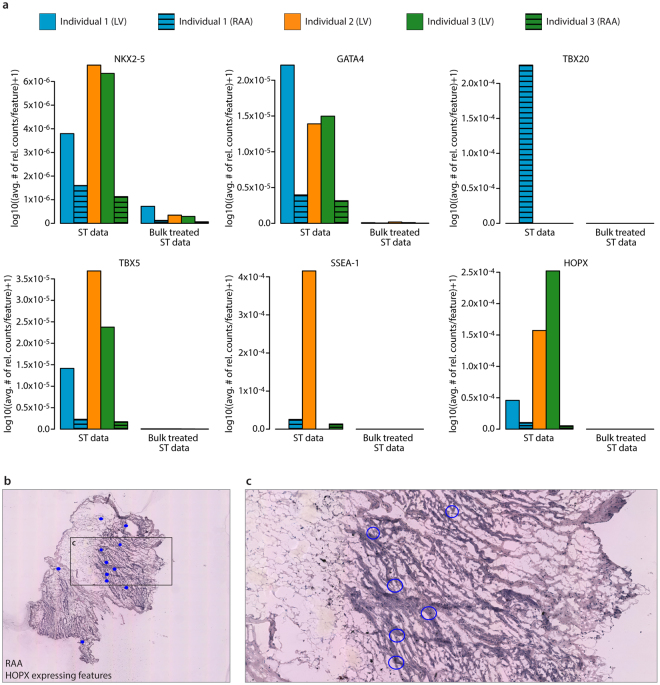
Detection of fetal gene expression within adult heart tissue sections. (a) Barplots showing the average number of relative fetal gene counts per feature. All numbers have been log-transformed after adding a pseudocount of 1. In the ST data, the number of features is based on features displaying read counts from indicated fetal marker gene. In the bulk treated ST data, the number of features is based on the total amount of features within the dataset. (b) Spatial view of individual features within RAA of individual 1 displaying expression of the HOPX gene. (c) Magnified image of corresponding area in (b) illustrating an example of features expressing HOPX.

