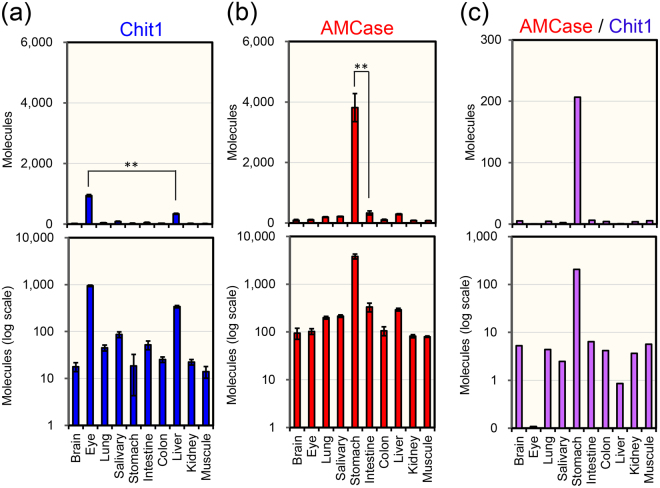
Figure 1.
Expression of Chit1 and AMCase mRNAs in pig tissues. Quantification of (a) Chit1 and (b) AMCase mRNAs in ten major pig tissues. Both chitinases were quantified by qPCR using the standard DNA. All values obtained were expressed as molecules per 10 ng of total RNA. (c) Ratios of AMCase to Chit1. All mRNA copy numbers were derived based on the same standard dilutions. The upper panels indicate the actual number, whereas the lower panel shows each value on logarithmic scale. Each reaction was performed in triplicate. **p < 0.01. P-values were determined using Student’s t-test.

