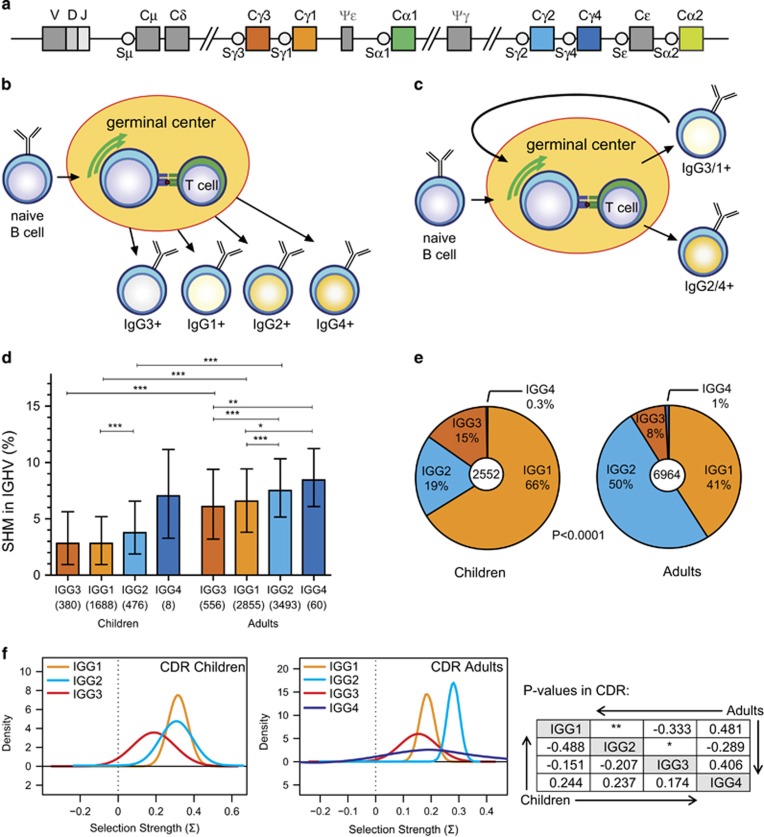
Figure 1.
Somatic hypermutation (SHM) levels and IGHG subclass usage in adults and children. (a) Schematic representation of the human IGH constant gene regions. (b) The temporal model of IgG class switching, where over the course of an immune response sequential switching towards IGHG3>IGHG1>IGHG2>IGHG4 occurs with increasing levels of SHM.10, 11 (c) Model for sequential IgG switching in secondary germinal center responses, where primary IgG memory B cells re-enter a germinal center in a secondary response, undergo additional SHMs and switch to a more downstream IgG subclass.6, 12 (d) SHM levels in IGHG transcripts determined with next generation sequencing (NGS) from nine children (aged 1–10 years) and 14 adults (aged 20–50 years). Data are shown as median bars with interquartile ranges. Statistical analysis of SHM levels between IGHG subclasses, and between children and adults, was done with the Kruskal–Wallis test and Dunn’s multiple comparison test: *P<0.05; **P<0.01; ***P<0.001. (e) IGHG subclass distribution in children and adults based on transcript analysis after next generation sequencing. Statistical analysis of CSR with the χ2 test. (f) Selection for replacement mutations in CDR regions of IGHG transcripts as calculated with the BASELINe program.32, 33 P values for CDR comparisons are shown in tabular format; *P<0.05; **P<0.01.

