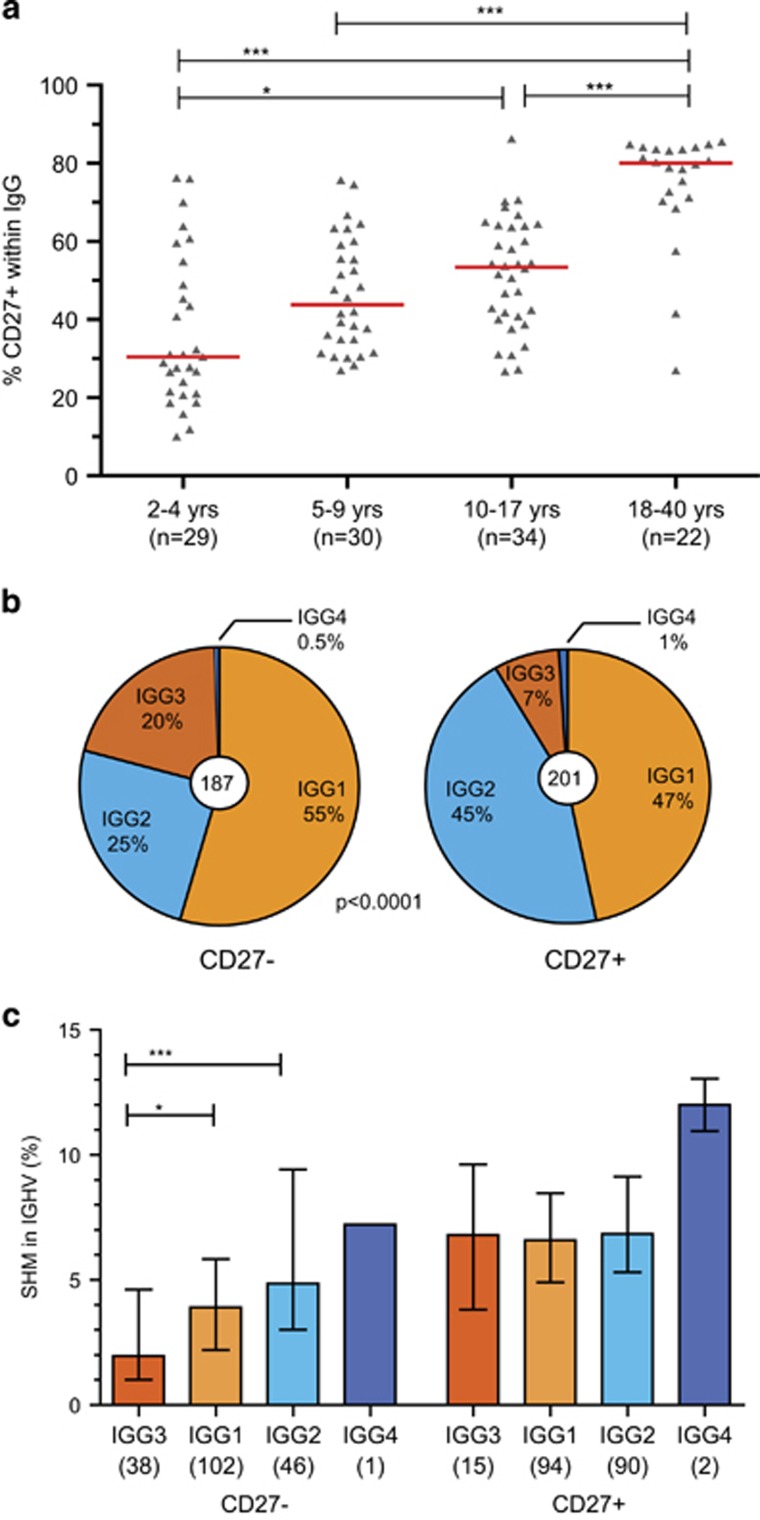
Figure 3.
SHM levels and IGHG subclass distributions in memory B cell subsets. (a) The frequencies of IgG+ B cells that express CD27 increase with age. (b) IGHG subclass distributions of CD27+ (eight donors) and CD27− IgG+ memory B-cell subsets (six donors). (c) SHM frequencies in IGHV of IGHG transcripts from memory B-cell subsets. Numbers of transcripts are indicated in brackets. Statistical analysis of SHM was done with the Kruskal–Wallis test and Dunn’s multiple comparison test and of CSR with the χ2 test; *P<0.05; **P<0.01; ***P<0.001.

