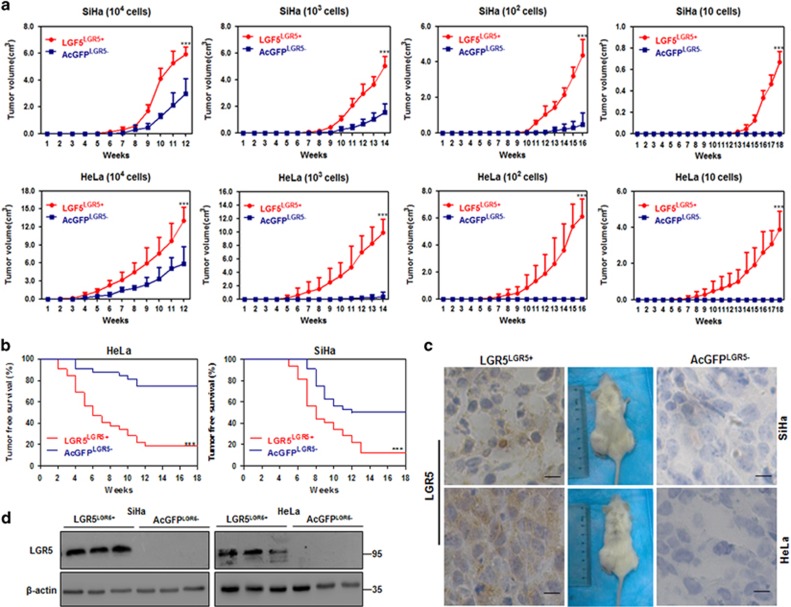
Figure 3.
Tumorigencity of LGR5LGR5+ and AcGFPLGR5– cells from two cervical cancer cell lines in NOD/SCID mice. (a) The volume of xenograft tumors formed by different numbers of LGR5LGR5+ and AcGFPLGR5− cervical cancer cells was monitored over time. (b) Kaplan–Meier plots showing the tumor-free survival after injection. (c, d) Immunohistochemical staining and western blot for LGR5 in tumor tissues, scale bar, 10 μm. *P<0.05; **P<0.01; ***P<0.001. Data represent mean±S.D. of tumor volumes at different time points of eight mice in each group

