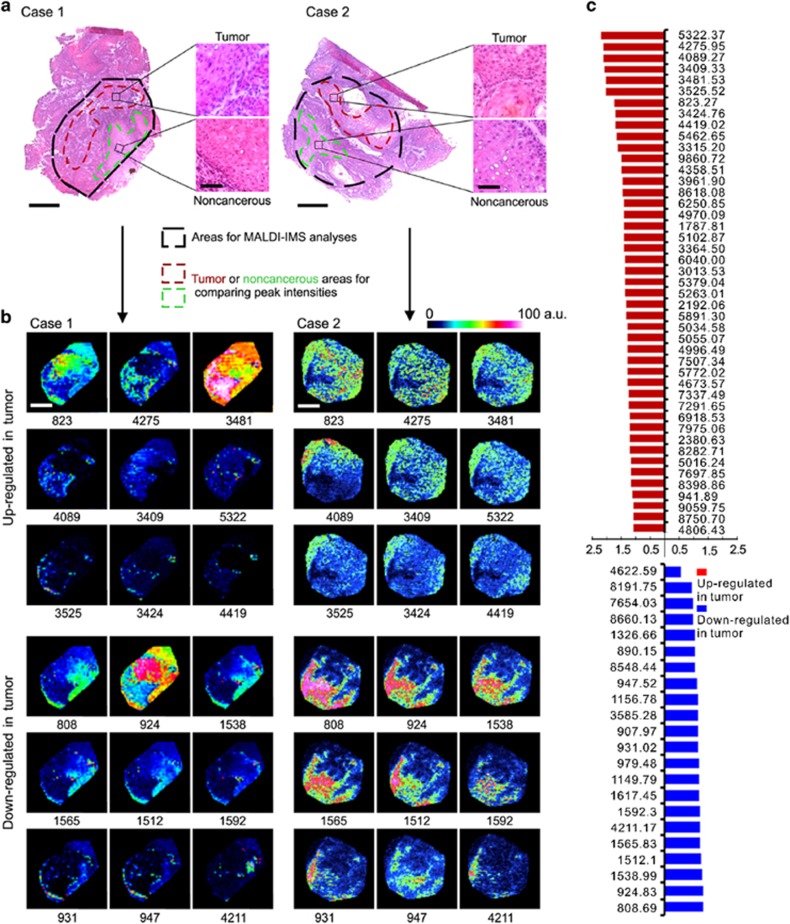
Figure 2.
Altered peptide peaks identified by MALDI-IMS. (a) Representative hematoxylin and eosin (H&E) staining images for OSCC areas and the adjacent noncancerous areas. The areas used for MALDI-IMS analyses were labeled by black dotted lines. The OSCC and adjacent noncancerous areas selected for identifying altered peaks were labeled by dark red or light green dotted line, respectively. Scale bar: original images, 250 μm; enlarged images, 50 μm. (b) Representative MALDI-MS images of 18 peaks with most significant alterations. Sample cases 1 and 2 are the same samples as shown in (a). The corresponding m/z value of each peak was shown under the image. (c) Intensities of 67 altered peaks. a.u., Arbitrary unit

