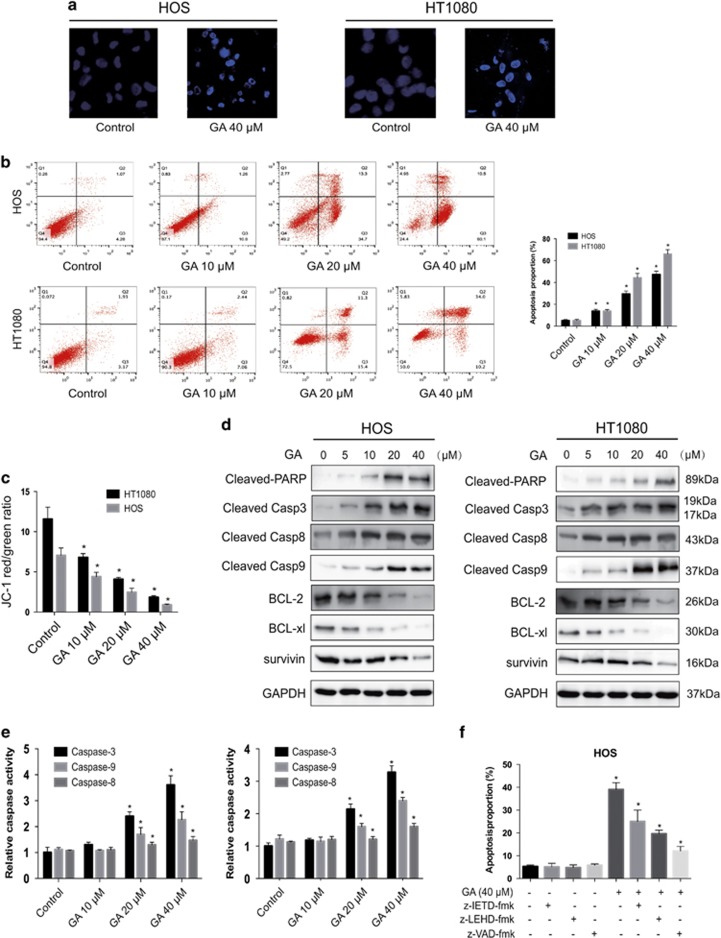
Figure 2.
Evidence that GA induces apoptosis in sarcoma cells. (a) Apoptotic morphological changes were evaluated by fluorescent microscopy using Hoechst 33342 staining. Arrows indicate chromatin condensation and DNA fragmentation. Bar, 50 μm. (b) HOS and HT1080 cells treated with GA were stained with annexin V-FITC/PI and analyzed by flow cytometry. The chart illustrates apoptosis proportion from three separate experiments. (c) The mitochondrial membrane potential was measured with JC-1 fluorescent probe and assessed by flow cytometry. The chart illustrates changes of JC-1 red/green rate from three independent experiments. (d and e) Cells were treated with various concentrations of GA for 24 h. The expressions of cleaved PARP, caspase-3, -8, -9, BCL-2, BCL-XL, and survivin were determined by western blot. (e) Caspase activity assay of cells treated with various concentrations of GA for 24 h. (f) HOS cells were incubated with or without GA for 24 h after 2 h of pretreatment with caspase inhibitors, z-IETD-fmk (10 μM), z-LEHD-fmk (40 μM), or z-VAD-fmk (20 μM). Then, cells were stained with annexin V-FITC/PI and analyzed by flow cytometry. Results are expressed as the mean±S.D. from three independent experiments. *P<0.05 versus control, #P<0.05 versus GA treatment

