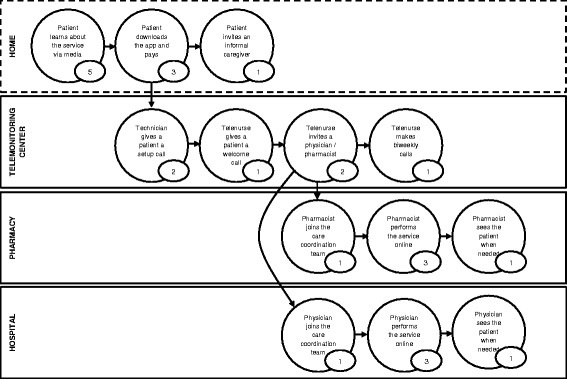
Fig. 2.

Care Experience Flow Map of the B2C model for telemonitoring patients with chronic heart failure (time in minutes). The map shows the experience of the patient on the B2C telemonitoring service, with a flow from one state to another, and time in minutes spent in each state. The flow is segmented according to the institution of care. The map shows what the experience of exchange in the B2C telemonitoring is, and is not exhaustive. Adapted from Patient and Family Centered Care Innovation Center of UPMC (PFCC, 2016)
