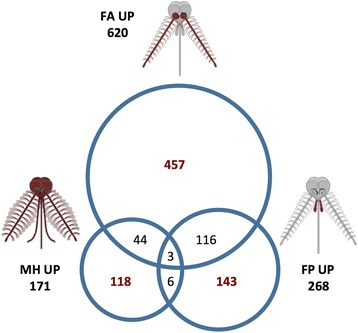
Fig. 2.

Pairwise sample comparisons. Proportional Venn diagram showing pairwise comparisons between female antennae, female palps and male heads. Gene subsets enhanced in each sample versus female body according to the edgeR threshold at P < 0.001 (see Table 2) were compared to each other. Overlaps (and relative numbers) represent the subsets of genes that are differentially expressed in more than one tissue
