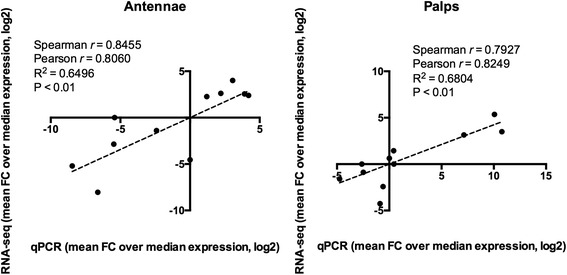
Fig. 9.

qPCR validation. Correlation between transcriptional abundance of 11 genes in both antennae (a) and maxillary palps (b) revealed by qPCR and RNA-seq. Level of abundance is defined as the ratio between each sample value over the group median (fold change, FC) in both qPCR and RNA-seq approaches. For both techniques, statistical evaluation throughout Spearman and Pearson tests was performed and results are reported in the figure insets
