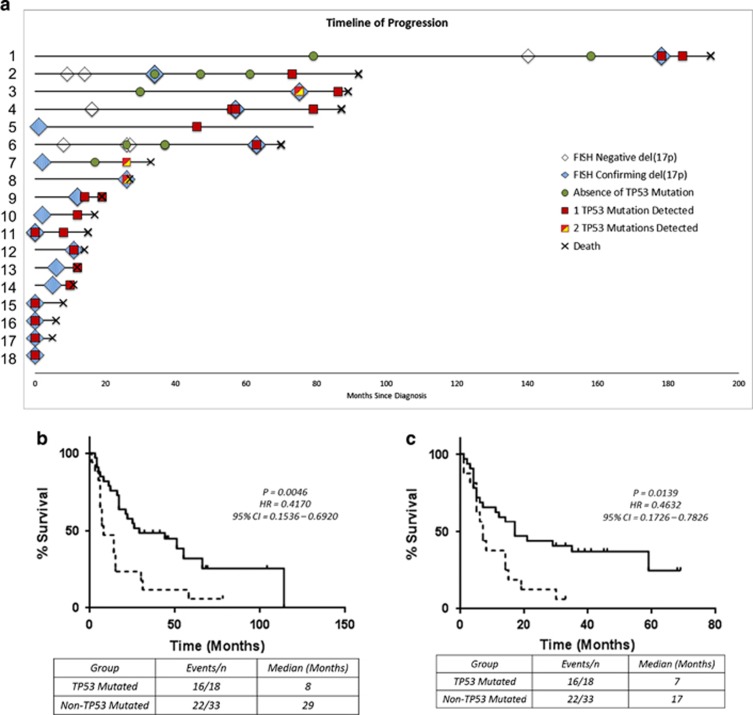
Figure 1.
Clinical impact of TP53 mutations. (a) Swimmer plot displaying the time of del(17p) FISH testing/detection and TP53 mutation screening for each TP53-mutated patient. Kaplan–Meier curves for (b) overall survival (OS) from first detection of del(17p) in patients with and without TP53 mutations, and (c) from first detection of the mutation in TP53-mutated patients compared to the last time point tested in non-mutated patients. Dotted Line, TP53-mutated patients; solid line, non-TP53 patients. CI, 95% confidence intervals; HR, hazard ratios.

