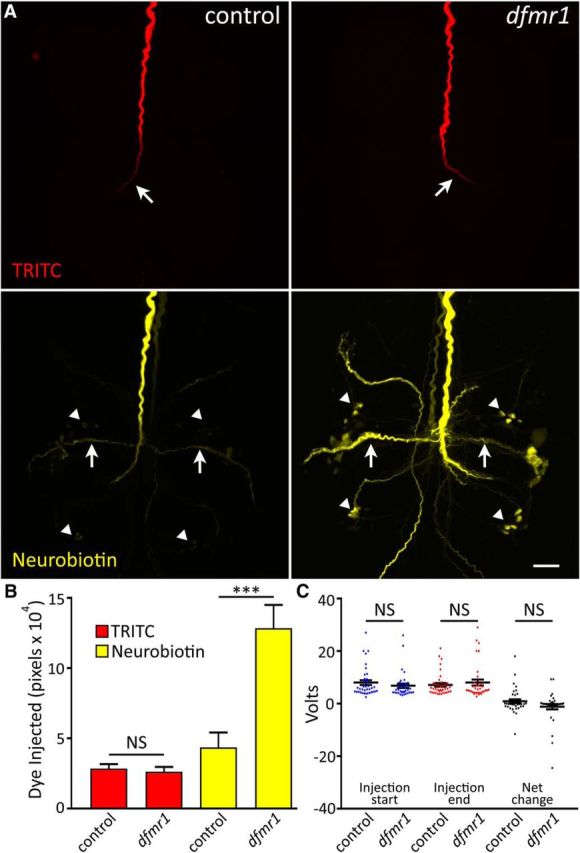
Figure 1.

Selective small dye iontophoresis is increased in dfmr1-null neurons. A, Representative images of the GFI coinjected with 10 kDa dextran-conjugated TRITC (red; top) and 287 Da NB (yellow; bottom) dissolved in 2 m KAc. Images show the thoracic ganglion for w1118 genetic background (control; left) and dfmr150M-null mutant (right). TRITC-dextran is too large to escape the injected GFI neuron, whereas NB passes through gap junctions to dye-coupled neurons in the GF neural circuit. Arrows indicates GFI bend (top) and PSI (bottom). Arrowheads indicate coupled cell bodies. Scale bar, 20 μm. B, Quantification of TRITC (red) and NB (yellow) dye injection displayed as mean ± SEM. TRITC: control, n = 36; dfmr1, n = 33; NB: control, n = 37; dfmr1, n = 36. C, Voltage required to deliver 20 nA of current to the GFI neuron in control and dfmr1-null mutants. Voltage is shown at the start (left) and end (middle) of each 2 min injection, and also as the net voltage change after a 2 min injection (right). Control, n = 38; dfmr1, n = 35. Significance determined from two-tailed unpaired t tests (B) or two-tailed Mann–Whitney tests (C): ***p < 0.001.
