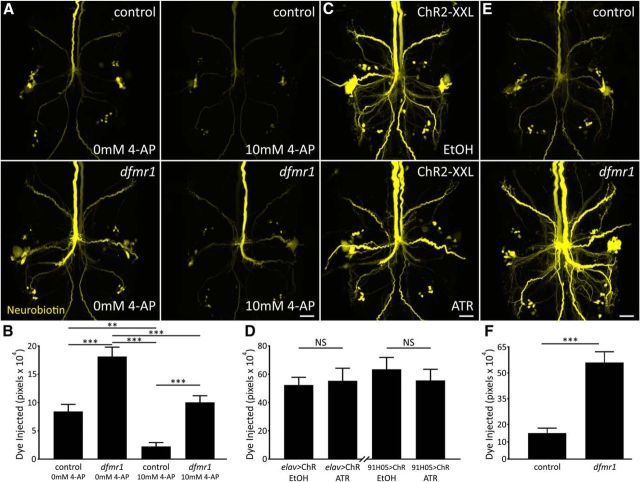
Figure 6.
K+ channel block reduces dye loading without correcting dfmr1 defect. A, Representative NB dye injections (2 m KAc) into GFI in w1118 genetic background (control; top) and dfmr150M-null mutant (bottom). Samples were bathed in standard saline (left) or standard saline + 10 mm 4-AP (right). Scale bar, 20 μm. B, Quantification of injected dye levels, displayed as mean ± SEM. 0 mm 4-AP: control, n = 15; dfmr1, n = 15; 10 mm 4-AP: control, n = 15; dfmr1, n = 15. C, Representative NB injections into GFI (ddH2O) for elav-Gal4-driven UAS-ChR2-XXL animals raised on EtOH vehicle (top) or ATR cofactor (bottom). Scale bar, 20 μm. D, Quantification of injected NB dye levels for both elav-GAL4 and 91H05-Gal4 (images not shown) driven UAS-ChR2-XXL, displayed as mean ± SEM; elav: EtOH, n = 14; ATR, n = 14; 91H05: EtOH, n = 10; ATR, n = 12. E, Representative NB dye injections into GFI (ddH2O) using an internal ground also within the GFI for the w1118 genetic background (top) and dfmr150M-null mutant (bottom). Scale bar, 20 μm. F, Quantification of injected dye levels for both genotypes, displayed as mean ± SEM. Control, n = 9; dfmr1, n = 10. Significance determined with two-tailed unpaired t test (F) and unpaired ANOVA (B, D): **p < 0.01, ***p < 0.001.

