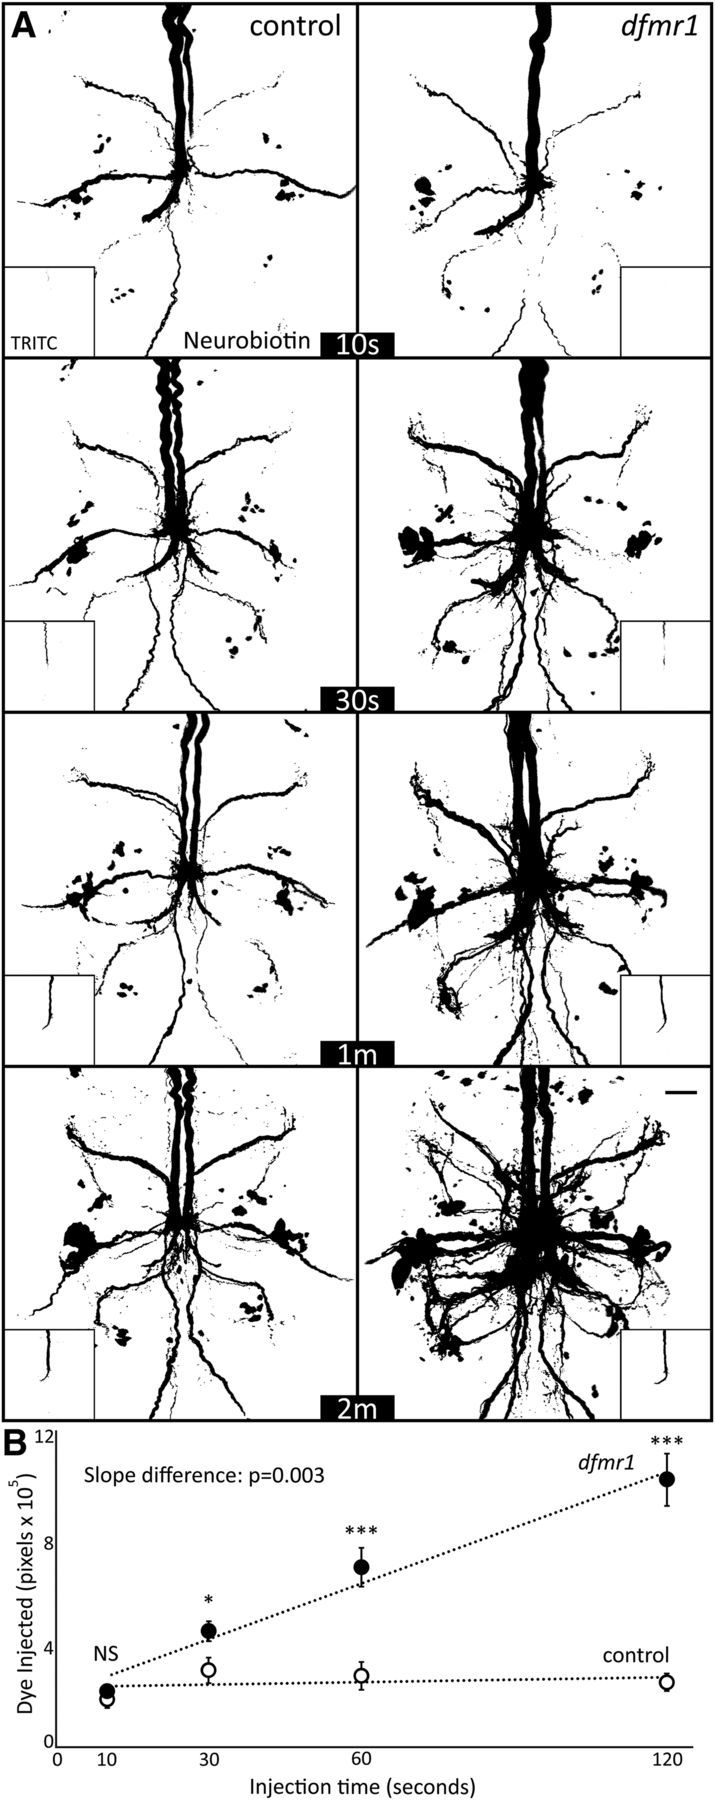
Figure 7.

Dye iontophoresis rate is highly elevated in dfmr1-null mutant neurons. A, Representative NB dye injection (ddH2O) images of GFI for the w1118 genetic background (control, left) and dfmr150M-null mutant (right) with progressively increasing periods of iontophoresis (10, 30, 60, and 120 s). The main images show NB dye loading, and insets show coinjected TRITC dye loading within the same neurons. All images display pixels above the threshold of 59. Scale bar, 20 μm. B, Quantification of injected dye levels at each of the four time points for both genotypes, displayed as mean ± SEM. Control 10 s, n = 10; control 30 s, n = 10; control 1 m, n = 10; control 2 m, n = 10; dfmr1 10 s, n = 10; dfmr1 30 s, n = 10; dfmr1 1 m, n = 9; dfmr1 2 m, n = 10. Significance determined from two-tailed unpaired t test (points) and unpaired ANCOVA (slope): *p < 0.05, **p < 0.01, ***p < 0.001.
