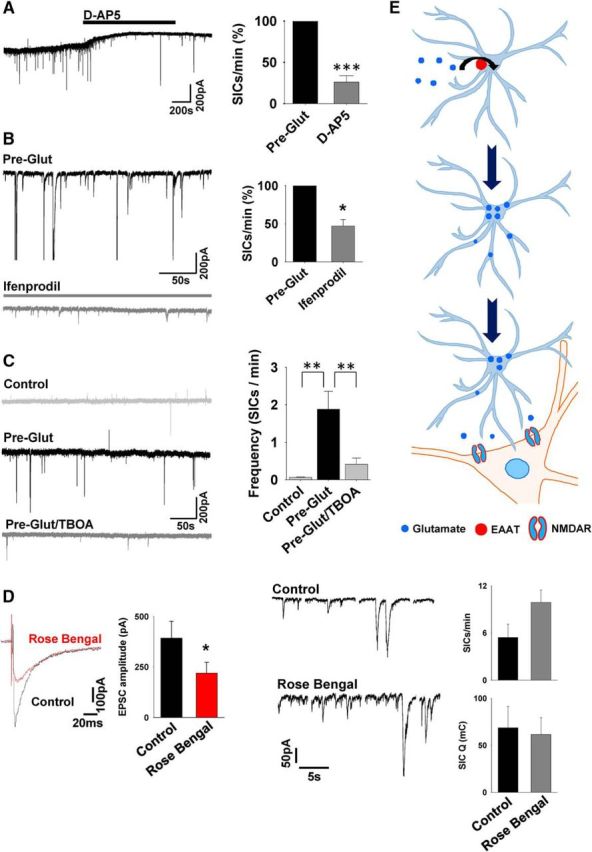
Figure 2.

Increased SIC frequency is EAAT dependent. A, TC neuron recording after Glut preexposure showing the blocking effect of the NMDAR antagonist D-AP5 on SICs. Summary data from multiple experiments are shown in the bar graph on the right. B, Experiment illustrating that the NR2B selective antagonist ifenprodil (gray trace, same cell) inhibits SICs. Summary data from multiple experiments are shown in the bar graph on the right. C, Example traces from recordings in slices preexposed in control aCSF (gray) with Glut for 2 h (black), and with Glut in the presence of the EAAT blocker TBOA for 4 h (light gray). Bar graph on the right summarizes a number of experiments. D, Traces (left) show evoked postsynaptic current before (black) and 20 min after perfusion of the VGlut inhibitor Rose Bengal (red) in a slice after reexposure to Glut for 2 h. Bar graph summarizes data from four experiments. Traces on right show SICs from the same neuron in the two conditions (evoked PSCs omitted for clarity) after a 3 h Pre-Glut. Bar graphs on the right display SIC frequency and charge in control and with Rose Bengal. E, Illustration depicting data interpretation that Glut is taken up via EAAT transporters and later released to activate extrasynaptic NMDARs on the neuron.
