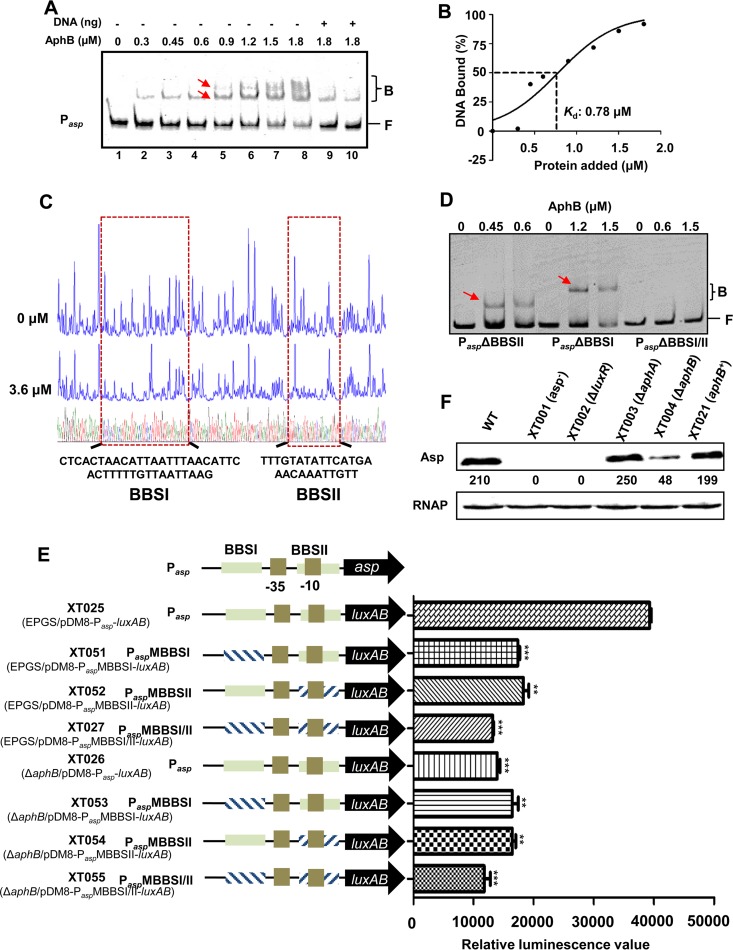
FIG 5.
AphB binding directly to the asp promoter to regulate its expression. (A) EMSA of the asp promoter with purified AphB. Twenty nanograms of each Cy5-labeled asp probe was added to the EMSA reaction mixtures. A 25- to 50-fold excess of unlabeled specific DNA (+) (lanes 9 and 10) and a 10-fold excess of nonspecific competitor DNA [poly(dI-dC)] (lanes 1 to 10) were included. The arrows indicate the two binding sites for the AphB protein (BBSI and BBSII) in the asp promoter. (B) Plot showing the affinity of AphB for the asp promoter. (C) DNase I footprinting analysis of BBSI and BBSII in the asp promoter. (D) The EMSA with the asp promoter variants and AphB. Variants of the promoter region of asp lacking BBSI (PaspΔBBSI), BBSII (PaspΔBBSII), or both binding sites (PaspΔBBSI/II) were used. A 10-fold excess of nonspecific competitor DNA [poly(dI-dC)] and 20 ng of each Cy5-labeled probe were added to the EMSA reaction mixtures. Arrows indicate the specific bands relative to BBSI and BBSII. B, bound bands; F, free or unbound bands. (E) Promoter activities of Pasp and its variants fused to luxAB and assayed in wt or ΔaphB strains. The fluorescence data are shown as the mean ± SEM from three experiments. **, P < 0.01; ***, P < 0.005, Student's t test, relative to the wt strain. (F) Western blot analysis of Asp production, performed using an Asp-specific antiserum. The optical density values counted with Gel-Pro analyzer software (Media Cybernetics) are shown below the bands. RNAP was used as a control for blot loading.

