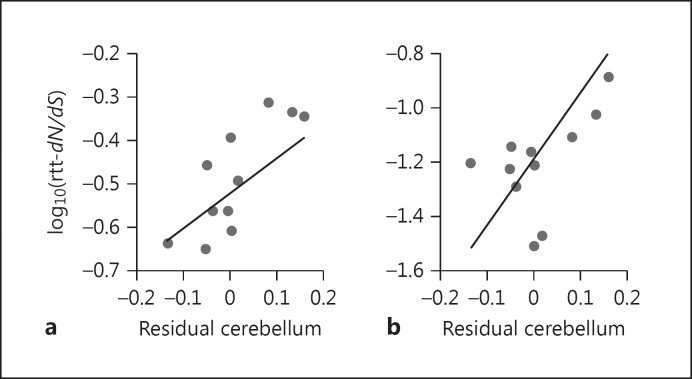
Fig. 2.
Phenotypic associations for two genes, i.e., RGRIP1L (a) and ATRN (b). The log10-transformed root-to-tip (rtt) dN/dS is plotted against residual cerebellum volume, calculated from a phylogenetic generalised least squares regression of cerebellum against neocortex volume. The line shows the result of a phylogenetically controlled regression between rtt-dN/dS and residual cerebellum volume. This figure is for illustrative purposes; in the main analyses the two brain components were included as variables in a multiple regression.

