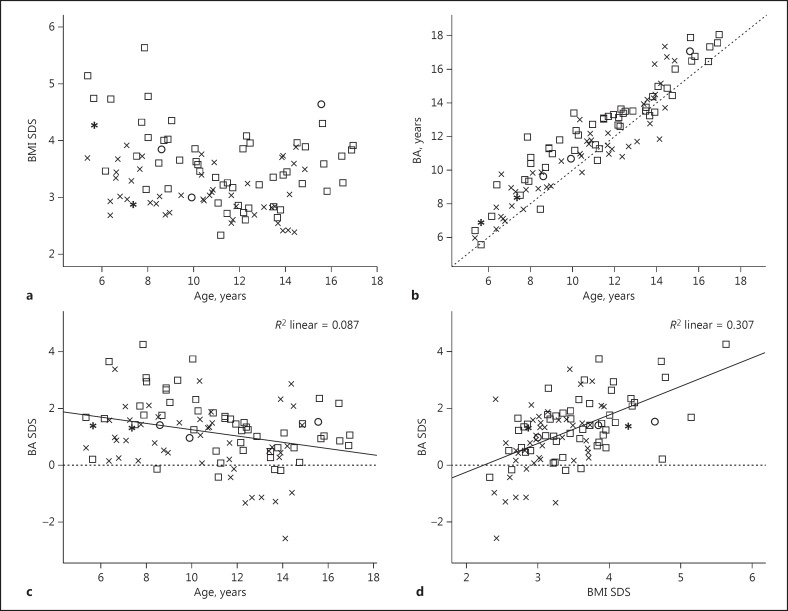
Fig. 2.
a Association between BMI SDS and age (years). b Association between BA (BA) (years) and chronological age (years). c Association between BA SDS and age. d Association between BA SDS and BMI SDS. SDS, standard deviation score; BMI, body mass index; BA, bone age; R2, coefficient of deviation. Squares represent males, x's represent females, circles represent males with monogenetic obesity, and asterisks represent females with monogenetic obesity.

