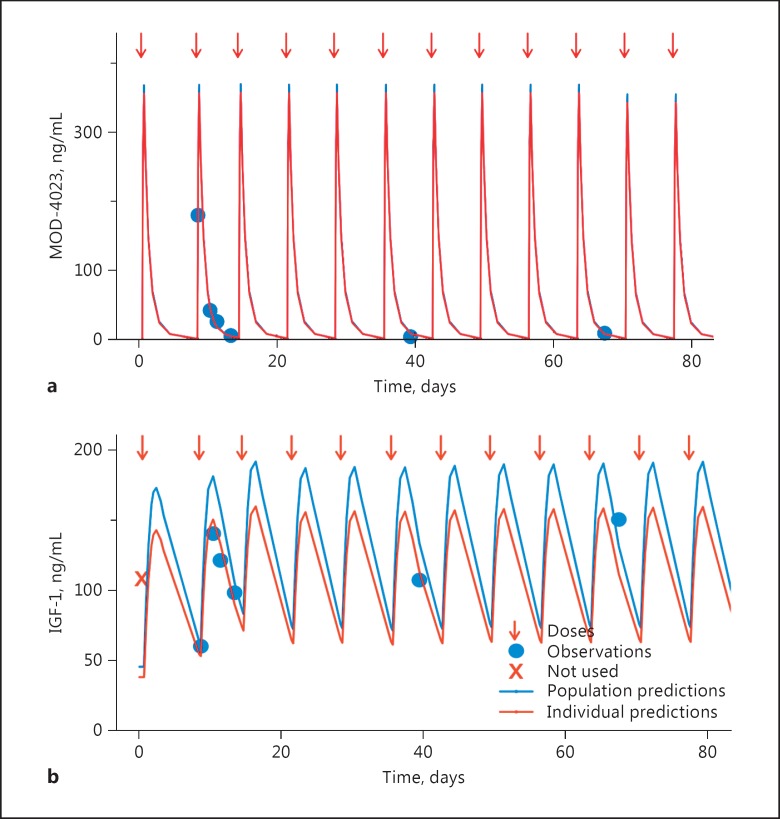
Fig. 4.
Representative pharmacokinetic (a) and pharmacodynamic (b) fits in children. A child aged 9 years and weighing 24 kg was dosed at weekly intervals with 0.25 mg/kg MOD-4023. Doses are indicated with arrows. Measured MOD-4023 and IGF-1 concentrations are displayed as circles. The blue line displays the population fit of the model to the data. The red line (which in general overlies the blue line in the upper panel) displays the individual (post hoc) fit of the model to the data.

