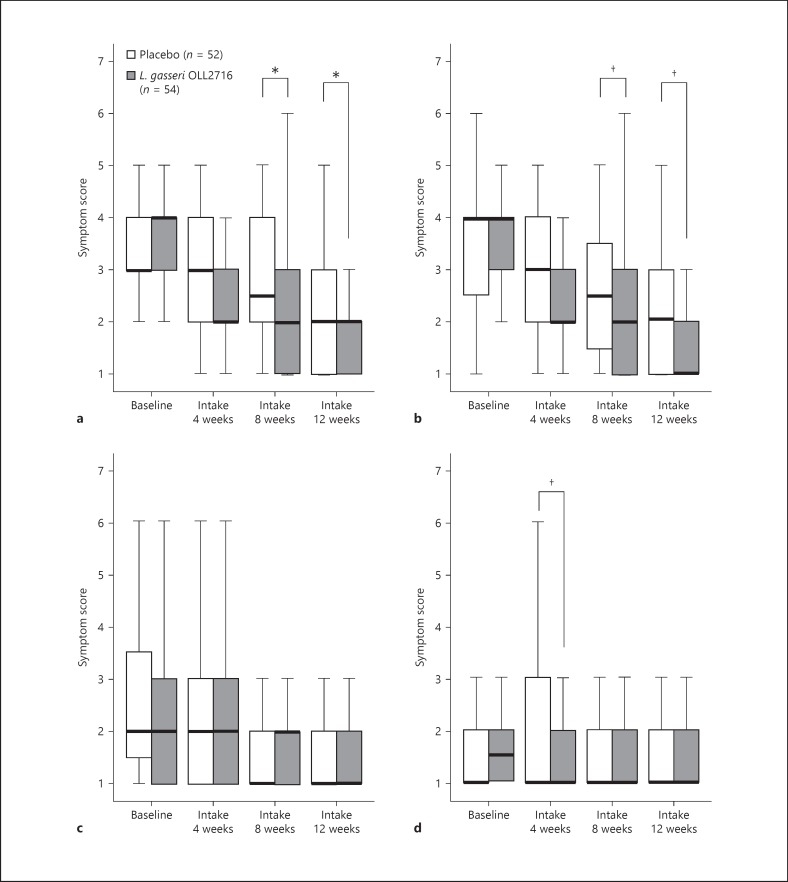
Fig. 6.
Individual FD symptom severity across time (per-protocol). The severity of individual FD symptoms was rated from 1 to 7, with 1 representing no symptoms, and higher numbers representing worsening of the symptoms. The severity is shown as a box plot graph (median 25-75 percentile; bar indicating 1.5 times the height of the box). Postprandial fullness (a), early satiety (b), epigastric pain (c), and epigastric burning (d). Group comparison; Wilcoxon rank sum test: †p < 0.10 (2-sided), * p < 0.05 (2-sided). FD, functional dyspepsia.

